Introduction to Box Plots
Opening
Introduction to Box Plots
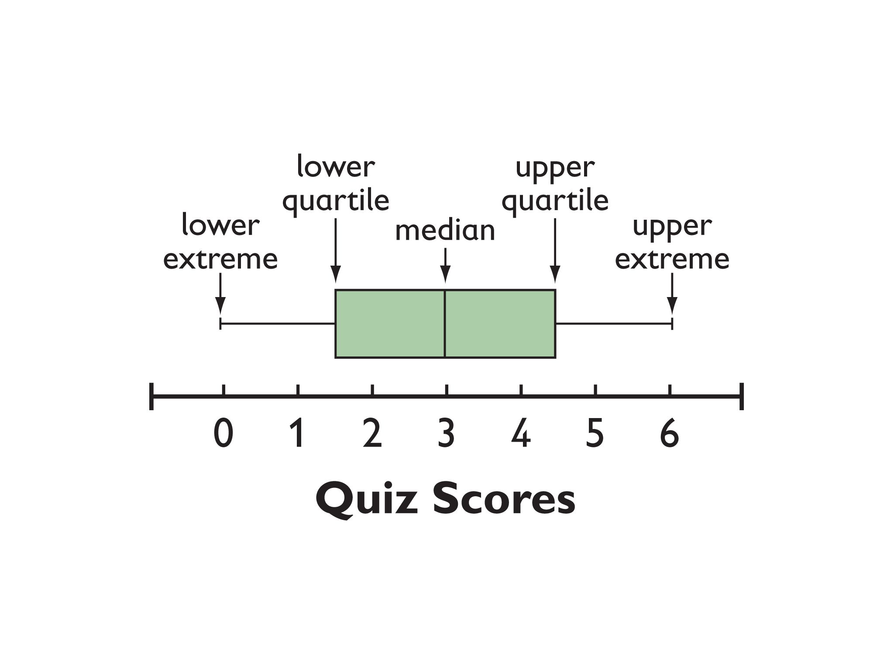
This image shows a box-and-whisker plot (or just a box plot).
Discuss the following information with your partner.
- To draw a box plot you need to know five numbers, called the five-number summary:
- Lower extreme: The least value in the set of data
- Lower quartile: The middle of the lower half of the data
- Median: The middle value
- Upper quartile: The middle of the upper half of the data
- Upper extreme: The greatest value in the set of data
- The box part of a box plot shows the spread of the middle 50 percent of the data. The length of the box is called the interquartile range and represents the distance between the upper and lower quartiles.