Introduction to Making Box Plots With Line Plots
Opening
Introduction to Making Box Plots With Line Plots
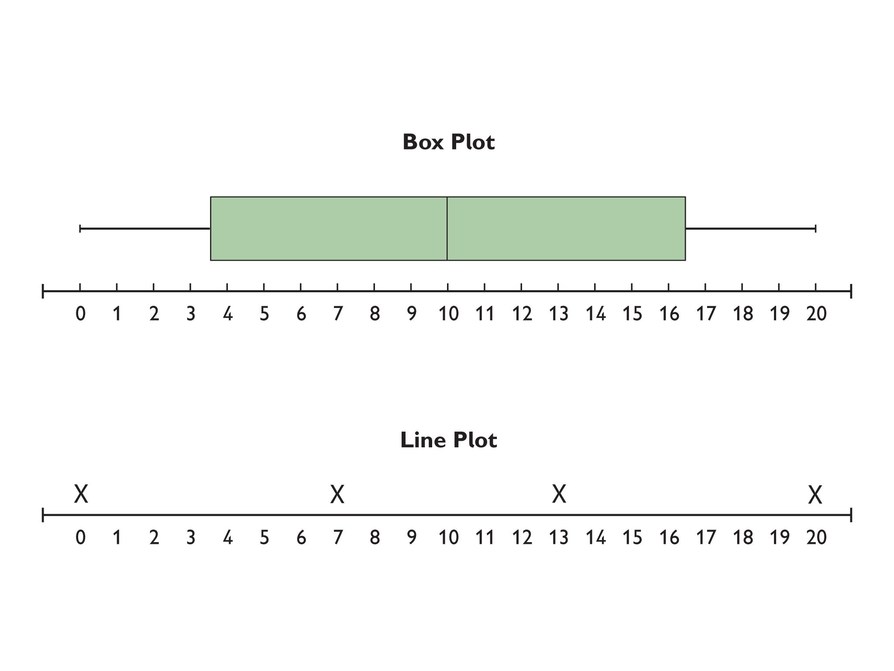
This line plot and box plot represent the same data:
{0, 7, 13, 20}
- Why doesn't the size of the box on the box plot line up with the data underneath it on the line plot?
- What would happen to the "whiskers" if you changed the value of the lower or upper extreme values?
- How are the box plot and line plot related?