Percent Statements about Data

Percent Statements about Data

The Global Village

Opening

The Global Village

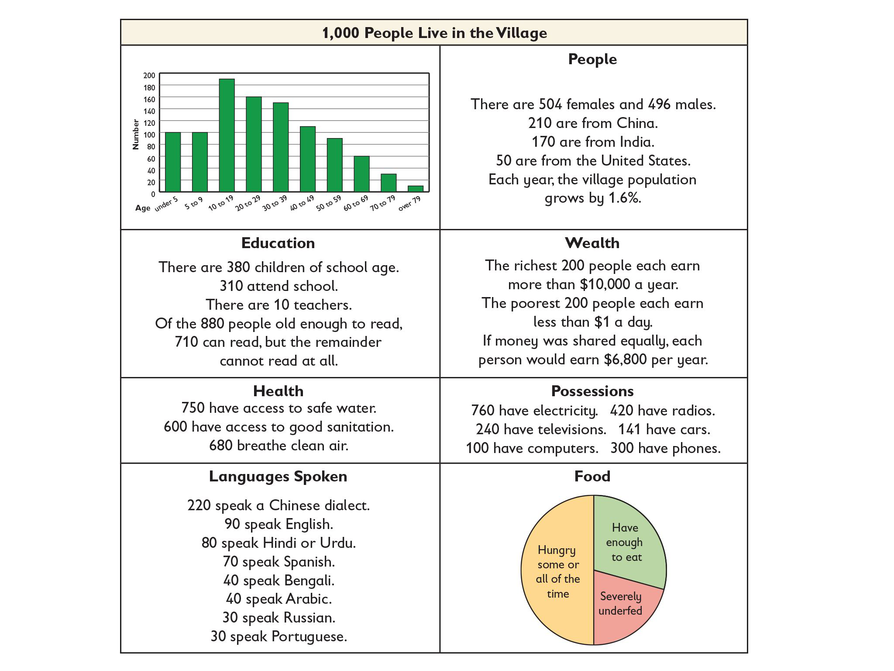
In the world today there are more than 7 billion people. If the world were shrunk to the size of a village, what would it be like?

Imagine the Global Village described in the table.

  • Choose one of the categories of data in the table, and write a statement in which you use percent to describe something about the data.

Math Mission

Opening

Explore and analyze data using percents.

Explore the Global Village Using Percents

Work Time

Explore the Global Village Using Percents

Work with a partner.

  • Take turns choosing a card. Based on the data in the Global Village table, decide whether the statement on the card belongs in the “True,” “False,” or “Cannot Tell” column.
  • Explain to your partner how you made your decision. Your partner should either agree with your explanation or challenge it if they think your explanation is not clear, correct, or complete.
  • When you both agree, move the card into the appropriate column.
  • Take notes on your reasons for deciding whether the statement on the card is true, false, or if you cannot tell; include any relevant calculations.
  • After you have placed all the cards, look at the cards in the “False” column. For each card, discuss with your partner what percent would make that statement true.

For some cards, you may need to add or subtract data in the Global Village table before you can calculate the percent given on the card.

Prepare a Presentation

Work Time

Prepare a Presentation

Select three cards, one from each of the three different columns you placed the cards in. Explain why you placed them in those columns.

Challenge Problem

  • Suppose the population of the Global Village is 786 instead of 1,000. Do you think the activity will be easier or more difficult using this new population? Explain your answer.
  • Suppose the world population is over 8 billion instead of 7 billion. Also suppose the Global Village population is still 1,000 and the data for the Global Village population is the same. Do you think the activity will be easier or more difficult with this change? Explain your answer.

Make Connections

Performance Task

Ways of Thinking: Make Connections

Take notes about your classmates' strategies for evaluating the statements on the cards.

As your classmates present, ask questions such as:

  • Did you use equations or expressions to test any of the statements on the cards? If so, how did doing this help you? If not, do you think using expressions or equations is a good idea?
  • How do you think representing this type of data with percent statements helps people interpret data?
  • Suppose a student thinks that the statement about 85% of school-aged children attending school represents a part-part relationship. How could you help the student think about the relationship more clearly?

Use Percents to Explore Data

Formative Assessment

Summary of the Math: Use Percents to Explore Data

Write a summary about how you used percents to analyze the Global Village data.

Check your summary.

  • Do you describe the data in the Global Village table?
  • Do you explain how you used percents to determine whether statements about data in the Global Village are true, false, or you can’t tell?

Reflect On Your Work

Work Time

Reflection

Write a reflection about the ideas discussed in class today. Use the sentence starter below if you find it to be helpful.

Some other places and ways I have seen percents used to report data are …