In this lesson, students use an interactive map to compare the crowdedness …
In this lesson, students use an interactive map to compare the crowdedness of three countries of their choice. They learn that to compare countries with different areas and populations, they need to calculate population density—a rate that compares the population of a region to its area.Key ConceptsA ratio is a comparison of two quantities by division. It can be expressed in the forms a to b, a:b, or ab, where b ≠ 0. The value of a ratio is found by dividing the two quantities. A ratio provides a relative comparison of two quantities. A rate is a ratio that compares two quantities measured in different units. Population density is a rate that compares the population of a region to its area. The value is given in number of people per unit of area.ELL: Identifying key words are crucial for students. Spend some time discussing the key vocabulary in this unit.Goals and Learning ObjectivesExplore rate in the context of population density.Compare three countries to see which is most crowded—that is, which has the greatest population density.
Gallery OverviewAllow students who have a clear understanding of the content thus …
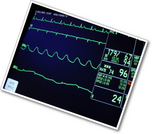
Gallery OverviewAllow students who have a clear understanding of the content thus far in the unit to work on Gallery problems of their choosing. You can then use this time to provide additional help to students who need review of the unit's concepts or to assist students who may have fallen behind on work.Gallery DescriptionsCreate Your Own RateStudents create their own rate problems, given three quantities that must all be used in the problems or the answers.Paper Clip ChallengeStudents think about rate in the context of setting a record for making a paperclip chain.The Speed of Light Students must determine the speed of light so they can figure out how long it will take a light beam from Earth to reach the Moon (assuming it would make it there). They conduct research and perform calculations.Tire WeightStudents connect area and a rate they may not be familiar with, tire pressure, to indirectly weigh a car. They find and add areas and do a simple rate calculation. Please note this problem requires adult supervision for the process of measuring the car tires. If no adult supervision is available, you can provide students with measurements to work with inside the classroom. Do not allow students to work with a car without permission from the owner and adult supervision.Planting Wildflowers Students apply area and length concepts (square miles, acres, and feet) to rectangles, choose and carry out appropriate area conversions, and show each step of their solutions. While specific solution paths will vary, all students who show good conceptualization will make at least one area conversion and show understanding about area even when dimensions and units change. This task allows several different correct solution paths.Train Track Students use information about laying railroad ties for the Union Pacific Railroad. These rates are different from those used elsewhere in the unit, asking how many rails per gang of workers, how long it takes to lay one mile of track, and how many spikes are needed for a mile of track.HeartbeatsStudents will investigate and compare the heartbeats of different animals and their own heartbeat.FoghornStudents use the relationships among seconds, minutes, and hours to find equivalent rates. Each step requires students to express an equivalent rate in terms of these different units of time. In any strong response, students use conversion factors and the given rate to find equivalent rates.
Gallery OverviewAllow students who have a clear understanding of the content thus …
Gallery OverviewAllow students who have a clear understanding of the content thus far in the unit to work on Gallery problems of their choosing. You can then use this time to provide additional help to students who need review of the unit's concepts or to assist students who may have fallen behind on work.Gallery DescriptionsDog and CatStudents refer to a pre-made graph showing how much dry food a dog eats and how much dry food a cat eats over the same time period. They analyze the graph and list specific information they can conclude from the graph.Faucet Rate ProblemStudents perform research on the Internet about standard water flow rates of bathroom faucets in the United States. They test faucets at home or at school and prepare responses to the questions.Shower versus BathStudents will use their knowledge of rates to figure out which uses less water, a shower or a bath.Laps, Miles, KilometersStudents use rates to convert measures given in laps, kilometers, and miles. They justify their reasons for ordering distances given in these three units.Paper ProblemStudents write and use formulas for heights of stacks of paper. They practice writing rates for h in terms of n and for n in terms of h.Three ScalesStudents use a triple number line to convert among the units laps on a track, kilometers, and miles. Given one number line, they mark two other number lines to show equal distances in the units.Water ProblemThis problem begins with a video of a cube container being filled with colored water. Students determine what information they'd need in order to figure out the volume of water in the cube at any time.
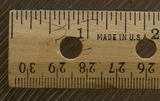
In this lesson, students use a ruler that measures both inches and …
In this lesson, students use a ruler that measures both inches and centimeters to find conversion factors for converting inches to centimeters and centimeters to inches.Key ConceptsRates can be used to convert a measurement in one unit to a corresponding measurement in another unit. We call rates that are used for such purposes conversion factors.The conversion factor 2.54 centimeters per inch is used to convert a measurement in inches to a measurement in centimeters (or, from the English system to the metric system).The conversion factor 0.3937 inches per centimeter is used to convert a measurement in centimeters to a measurement in inches (or, from the metric system to the English system).In the calculation, the inch units cancel out and the remaining centimeter units are the units of the answer, or vice versa.Goals and Learning ObjectivesExplore rate in the context of finding and using conversion factors.Understand that there are two conversion factors that translate a measurement in one unit to a corresponding measurement in another unit, and that these two conversion factors are inverses of one another.
In this lesson, students represent quantitative relationships involving rates using tables, graphs, …
In this lesson, students represent quantitative relationships involving rates using tables, graphs, double number lines, and formulas. Students will understand how to create one such representation when given another representation.Key ConceptsQuantitative relationships involving rates can be represented using tables, graphs, double number lines, and formulas. One such representation can be used to create another representation. Two rates can describe each situation: the rate and its inverse. For the water pump situation, there are two related formulas: a formula for finding the quantity of water pumped for any amount of time, and a formula for finding the amount of time for any quantity of water.Goals and Learning ObjectivesUnderstand that tables, graphs, double number lines, and formulas can be used to represent the same situation.Compare the different representations within a situation and the same representation across similar situations.Understand each representation and how to find the rate in each one.
In this lesson, students use their knowledge of rates, graphs of rates, …
In this lesson, students use their knowledge of rates, graphs of rates, and formulas to solve problems.Key ConceptsThe formula for a rate is a mathematical way of writing a rule for computing a value. Rate formulas describe a constant relationship between two quantities. Each point on the graph of a rate shows a pair of related values. A graph of a constant rate is a straight line.Goals for Learning ObjectivesUncover any partial understandings and misconceptions students have about rate, graphs of rates, and formulas.Develop a more robust understanding of rate.Help identify which Gallery problems students should work on.
In this lesson, students focus on the units used with rates. Students …
In this lesson, students focus on the units used with rates. Students are given calculations without units and must determine the correct units to use.Key ConceptsWhen dividing quantity A by quantity B to find a rate, the unit of the quotient is expressed in the form A per B.When multiplying a B quantity by an A per B rate, you get an A quantity.Some rates, while mathematically correct, are physically impossible in the real world.Goals and Learning ObjectivesUnderstand the units that result from rate calculations.
In this lesson, students write formulas to represent different rate relationships.Key ConceptsA …
In this lesson, students write formulas to represent different rate relationships.Key ConceptsA formula is a mathematical way of writing a rule for computing a value.Formulas, like c = 2.50w or d = 20g, describe the relationship between quantities.The formula c = 2.50w describes the relationship between a cost and a quantity that costs $2.50 per unit of weight. Here, w stands for any weight, and c stands for the cost of w pounds at $2.50 per pound.The formula d = 20g describes the relationship between the distance, d, and the number of gallons of gas, g, for a car that gets 20 miles per gallon.Goals and Learning ObjectivesUse equations with two variables to express relationships between quantities that vary together.
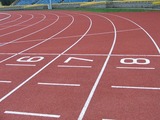
In this lesson, students first watch three racers racing against each other. …
In this lesson, students first watch three racers racing against each other. The race is shown on a track and represented on a graph. Students then change the speed, distance, and time to create a race with different results. They graph the new race and compare their graph to the original race graph.Key ConceptsA rate situation can be represented by a graph. Each point on a graph represents a pair of values. In today's situation, each point represents an amount of time and the distance a racer traveled in that amount of time. Time is usually plotted on the horizontal axis. The farther right a point is from the origin, the more time has passed from the start. Distance is usually plotted on the vertical axis. The higher up a point is from the origin, the farther the snail has traveled from the start. A graph of a constant speed is a straight line. Steeper lines show faster speeds.Goals and Learning ObjectivesUnderstand that a graph can be a visual representation of an actual rate situation.Plot pairs of related values on a graph.Use graphs to develop an understanding of rates.
In this lesson, students watch a video of a runner and express …
In this lesson, students watch a video of a runner and express his speed as a rate in meters per second. Students then use the rate to determine how long it takes the runner to go any distance.Key ConceptsSpeed is a rate that is expressed as distance traveled per unit of time. Miles per hour, laps per minute, and meters per second are all examples of units for speed. The measures of speed, distance, and time are all related. The relationship can be expressed in three ways: d = rt, r = dt, t = dr.Goals and Learning ObjectivesExplore speed as a rate that measures the relationship between two aspects of a situation: distance and time.In comparing distance, speed, and time, understand how to use any two of these measures to find the third measure.
Students use their knowledge of rates to solve problems.Key ConceptsGiven any two …
Students use their knowledge of rates to solve problems.Key ConceptsGiven any two values in a rate situation, you can find the third value.These three equations are equivalent, and they all describe rate relationships:y = rx, r = yx, x = yrAt the beginning of this lesson (or for homework), students will revise their work on the pre-assessment Self Check. Their revised work will provide data that you and your students can use to reassess students' understanding of rate. You can use this information to clear up any remaining misconceptions and to help students integrate their learning from the past several days into a deeper and more coherent whole.The work students do in this lesson and in revising their pre-assessments will help you and your students decide how to help them during the Gallery. In this lesson, students will reveal the depth and clarity of their understanding of rate.Students whose understanding of rate is still delicate should get extra help during the Gallery.Students who feel that they have a robust understanding of rate may choose from any of the problem-solving or deeper mathematics problems in the Gallery.Goals and Learning ObjectivesUncover any partial understandings and misconceptions about rate.Develop a more robust understanding of rate.Identify which Gallery problems to work on.
Students watch a video in which two students discuss the problem of …
Students watch a video in which two students discuss the problem of how to compare fuel efficiency. Students then analyze the work of the two students as they use rates to determine fuel efficiency in two different ways.Key ConceptsFuel efficiency is a rate. Fuel efficiency can be expressed in miles per gallon (mpg). This rate is useful for determining how far a vehicle can travel using any number of gallons of gas. Fuel efficiency can also be expressed in gallons per mile (gpm). This rate is useful for determining how many gallons of gas a vehicle uses to travel any number of miles.The rates miles per gallon and gallons per mile are inverse rates—they both describe the same relationship. For example, the rates 20 miles per gallon and 0.05 gallon per mile both describe the relationship between 300 miles and 15 gallons. The greater the rate in miles per gallon, the better the fuel efficiency. The smaller the rate in gallons per mile, the better the fuel efficiency.SWD: Some students with disabilities will benefit from a preview of the goals in each lesson. This will help to highlight for students the critical features and/or concepts and will help them to pay close attention to salient information.Goals and Learning ObjectivesExplore rate in the context of fuel efficiency.Express fuel efficiency as the rate miles per gallon (mpg) and as its inverse, gallons per mile (gpm).Use the rate miles per gallon to find the number of miles a car can travel on a number of gallons of gas.Use the rate gallons per mile to find the number of gallons of gas used for a number of miles driven.
Rational Numbers Type of Unit: Concept Prior Knowledge Students should be able …
Rational Numbers
Type of Unit: Concept
Prior Knowledge
Students should be able to:
Solve problems with positive rational numbers. Plot positive rational numbers on a number line. Understand the equal sign. Use the greater than and less than symbols with positive numbers (not variables) and understand their relative positions on a number line. Recognize the first quadrant of the coordinate plane.
Lesson Flow
The first part of this unit builds on the prerequisite skills needed to develop the concept of negative numbers, the opposites of numbers, and absolute value. The unit starts with a real-world application that uses negative numbers so that students understand the need for them. The unit then introduces the idea of the opposite of a number and its absolute value and compares the difference in the definitions. The number line and positions of numbers on the number line is at the heart of the unit, including comparing positions with less than or greater than symbols.
The second part of the unit deals with the coordinate plane and extends student knowledge to all four quadrants. Students graph geometric figures on the coordinate plane and do initial calculations of distances that are a straight line. Students conclude the unit by investigating the reflections of figures across the x- and y-axes on the coordinate plane.
Students watch a video showing the highest and lowest locations on each …
Students watch a video showing the highest and lowest locations on each of the continents. Then they create a diagram (a number line) for a book titled The World’s Highest and Lowest Locations. Students show four of the highest elevations and four of the lowest elevations in the world on their diagrams.Key ConceptsA complete number line has both positive numbers (to the right of 0) and negative numbers (to the left of 0).Negative numbers are written with a minus sign—for example, –12, which is pronounced “negative 12.”Positive numbers can be written with a plus sign for emphasis, such as +12, but a number without a sign, such as 12, is always interpreted as positive.Every number except 0 is either positive or negative. The number 0 is neither positive nor negative.Goals and Learning ObjectivesCreate a number line to show elevations that are both above and below sea level.
Students revise their work on the Self Check based on feedback from …
Students revise their work on the Self Check based on feedback from the teacher and their peers.Key ConceptsConcepts from previous lessons are integrated into this assessment task: integers, absolute value, and comparing numbers. Students apply their knowledge, review their work, and make revisions based on feedback from the teacher and their peers. This process creates a deeper understanding of the concepts.Goals and Learning ObjectivesApply your knowledge of integers, absolute value, and comparing numbers to solve problems.Track and review your choice of strategy when problem solving.
Students play a game in which they try to find dinosaur bones …
Students play a game in which they try to find dinosaur bones in an archaeological dig simulator. The players guess where the bones are on the coordinate plane using hints and reasoning.Key ConceptsThe coordinate plane consists of a horizontal number line and a vertical number line that intersect at right angles. The point of intersection is the origin, or (0,0). The horizontal number line is often called the x-axis. The vertical number line is often called the y-axis.A point’s location on the coordinate plane can be described using words or numbers. Ordered pairs name locations on the coordinate plane. To find the location of the ordered pair (m,n), first locate m on the x-axis and draw a vertical line through this point. Then locate n on the y-axis and draw a horizontal line through this point. The intersection of these lines is the location of (m,n).The coordinate plane is divided into four quadrants:Quadrant I: (+,+)Quadrant II: (−,+)Quadrant III: (−,−)Quadrant IV: (+,−)Goals and Learning ObjectivesName locations on the coordinate plane.
Students draw a figure on the coordinate plane that matches a written …
Students draw a figure on the coordinate plane that matches a written description.Key ConceptsOrdered pairs name locations on the coordinate plane. The first coordinate tells how many units to go left or right of the origin (0,0) along the x-axis. The second coordinate tells how many units to go up or down from the origin along the y-axis.Goals and Learning ObjectivesDraw a figure that matches a description of a figure on the coordinate plane.Give coordinates of points on the coordinate plane.Write descriptions of figures on the coordinate plane.
Gallery OverviewAllow students who have a clear understanding of the content thus …
Gallery OverviewAllow students who have a clear understanding of the content thus far in the unit to work on Gallery problems of their choosing. You can then use this time to provide additional help to students who need review of the unit's concepts or to assist students who may have fallen behind on work.Gallery DescriptionThe SurveyorStudents will read and follow a land surveyor's instructions in order to draw property boundaries on a coordinate plane.The Ink BlotOops! Part of a land surveyor’s report is covered by an ink blot. Students will figure out what the missing instructions are in order to draw property boundaries on a coordinate plane.A Mistake in the SurveyThe surveyor made a mistake! Students will correct the mistake in order to draw property boundaries on a coordinate plane.More ReflectionsStudents will reflect a figure located in two quadrants across the x-axis.Reflect Across the OriginStudents will reflect a figure across the origin and observe what happens to the coordinates of the figure.Reflect LettersStudents will reflect letters of the alphabet across the origin and observe what happens to the letters.Graphing a Coordinate Plane VideoStudents will create a video about graphing on the coordinate plane.HistoryStudents will create a report, poster, or video about the history of the coordinate plane.
Gallery OverviewAllow students who have a clear understanding of the content thus …
Gallery OverviewAllow students who have a clear understanding of the content thus far in the unit to work on Gallery problems of their choosing. You can then use this time to provide additional help to students who need review of the unit's concepts or to assist students who may have fallen behind on work.Gallery DescriptionDivingChen stands on top of a cliff, and a woman scuba diver dives in the ocean below. Students will determine their positions on a vertical number line that represents distance above and below sea level.Negative Numbers?Students will read about five students’ opinions about negative numbers and decide whose opinions they agree with, whose they disagree with, and why. Students will also share their own ideas about negative numbers.Temperatures in JanuaryA map shows the lowest temperatures recorded in January since 2008 for five cities. Students will locate these temperatures on a number line and compare the temperatures.Greenwich Mean TimeStudents will use positive and negative numbers and Greenwich Mean Time to find the times of different cities around the world.Numbers TimelineStudents will research the history of negative numbers and absolute value and create a timeline to show what they learned.Rational Numbers and Absolute Value VideoStudents will create a video about rational numbers and absolute value.
Students identify whether an inequality statement is true or false using a …
Students identify whether an inequality statement is true or false using a number line to support their reasoning.Key ConceptsThe meaning of mThe meaning of n > m is that n is located to the right of m on a number line. The inequality statement n > m is read “n is greater than m.”To decide on the order of two numbers m and n, locate the numbers on a number line. If m is to the left of n, then m < n. If m is to the right of n, then m > n.Goals and Learning ObjectivesState whether an inequality is true or false.Use a number line to prove that an inequality is true or false.
No restrictions on your remixing, redistributing, or making derivative works. Give credit to the author, as required.
Your remixing, redistributing, or making derivatives works comes with some restrictions, including how it is shared.
Your redistributing comes with some restrictions. Do not remix or make derivative works.
Most restrictive license type. Prohibits most uses, sharing, and any changes.
Copyrighted materials, available under Fair Use and the TEACH Act for US-based educators, or other custom arrangements. Go to the resource provider to see their individual restrictions.