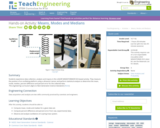
Students experience data collection, analysis and inquiry in this LEGO® MINDSTORMS® NXT …
Students experience data collection, analysis and inquiry in this LEGO® MINDSTORMS® NXT -based activity. They measure the position of an oscillating platform using a ultrasonic sensor and perform statistical analysis to determine the mean, mode, median, percent difference and percent error for the collected data.
This lesson looks at the different measures of center and variability that …
This lesson looks at the different measures of center and variability that are used when analyzing the spread of data in a distribution. Includes downloadable study guide with exercises - guide also covers other topics. [17:21]
Watch and listen as the assistant general manager of a major league …
Watch and listen as the assistant general manager of a major league baseball team explains how he uses math in this video from KAET, Arizona PBS. A lesson plan and handouts are included. [7:43]
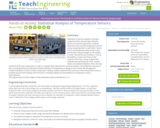
Working as if they are engineers aiming to analyze and then improve …
Working as if they are engineers aiming to analyze and then improve data collection devices for precision agriculture, students determine how accurate temperature sensors are by comparing them to each other. Teams record soil temperature data during a class period while making changes to the samples to mimic real-world crop conditions—such as the addition of water and heat and the removal of the heat. Groups analyze their collected data by finding the mean, median, mode, and standard deviation. Then, the class combines all the team data points in order to compare data collected from numerous devices and analyze the accuracy of their recording devices by finding the standard deviation of temperature readings at each minute. By averaging the standard deviations of each minute’s temperature reading, students determine the accuracy of their temperature sensors. Students present their findings and conclusions, including making recommendations for temperature sensor improvements.
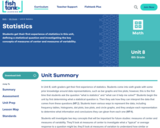
Students get their first experience of statistics in this unit, defining a …
Students get their first experience of statistics in this unit, defining a statistical question and investigating the key concepts of measures of center and measures of variability.
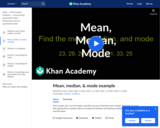
This 4-minute video lesson explains the mean, median, and mode. [Statistics playlist: …
This 4-minute video lesson explains the mean, median, and mode. [Statistics playlist: Lesson 1 of 85]
Khan Academy learning modules include a Community space where users can ask questions and seek help from community members. Educators should consult with their Technology administrators to determine the use of Khan Academy learning modules in their classroom. Please review materials from external sites before sharing with students.
Download these free worksheets to sharpen your skills with statistics and probability. …
Download these free worksheets to sharpen your skills with statistics and probability. Sheets focus on collecting and organizing data, measures of central tendency (mean, median, mode, and range), and probability.
Students collect a large set of data (approximately 60 sets) of individual …
Students collect a large set of data (approximately 60 sets) of individual student’s water use and learn how to use spreadsheets to graph the data and find mean, median, mode, and range. They compared their findings to the national average of water use per person per day and use it to evaluate how much water a municipality would need in the event of a recovery from a water shutdown. This analysis activity introduces students to the concept of central tendencies and how to use spreadsheets to find them.
(Nota: Esta es una traducción de un recurso educativo abierto creado por …
(Nota: Esta es una traducción de un recurso educativo abierto creado por el Departamento de Educación del Estado de Nueva York (NYSED) como parte del proyecto "EngageNY" en 2013. Aunque el recurso real fue traducido por personas, la siguiente descripción se tradujo del inglés original usando Google Translate para ayudar a los usuarios potenciales a decidir si se adapta a sus necesidades y puede contener errores gramaticales o lingüísticos. La descripción original en inglés también se proporciona a continuación.)
En este módulo, los estudiantes reconectan y profundizan su comprensión de las estadísticas y los conceptos de probabilidad introducidos por primera vez en los grados 6, 7 y 8. Los estudiantes desarrollan un conjunto de herramientas para comprender e interpretar la variabilidad en los datos, y comienzan a tomar decisiones más informadas de los datos . Trabajan con distribuciones de datos de varias formas, centros y diferenciales. Los estudiantes se basan en su experiencia con datos cuantitativos bivariados del grado 8. Este módulo prepara el escenario para un trabajo más extenso con muestreo e inferencia en calificaciones posteriores.
Encuentre el resto de los recursos matemáticos de Engageny en https://archive.org/details/engageny-mathematics.
English Description: In this module, students reconnect with and deepen their understanding of statistics and probability concepts first introduced in Grades 6, 7, and 8. Students develop a set of tools for understanding and interpreting variability in data, and begin to make more informed decisions from data. They work with data distributions of various shapes, centers, and spreads. Students build on their experience with bivariate quantitative data from Grade 8. This module sets the stage for more extensive work with sampling and inference in later grades.
Find the rest of the EngageNY Mathematics resources at https://archive.org/details/engageny-mathematics.
No restrictions on your remixing, redistributing, or making derivative works. Give credit to the author, as required.
Your remixing, redistributing, or making derivatives works comes with some restrictions, including how it is shared.
Your redistributing comes with some restrictions. Do not remix or make derivative works.
Most restrictive license type. Prohibits most uses, sharing, and any changes.
Copyrighted materials, available under Fair Use and the TEACH Act for US-based educators, or other custom arrangements. Go to the resource provider to see their individual restrictions.