In this lesson, you will learn how to solve linear inequalities as well as how to graph the solutions on number lines and the XY plane. [8:22]
- Subject:
- Mathematics
- Material Type:
- Audio/Video
- Provider:
- Study Pug
- Date Added:
- 12/01/2023

In this lesson, you will learn how to solve linear inequalities as well as how to graph the solutions on number lines and the XY plane. [8:22]

This video teaches how to determine if an expression is a linear equation; and how to graph a linear equation. [1:35]

Show me the money! In this video, we are going to solve some linear equations word problems that are related to money. [5:36]
![Teaching With Collections [PDF]](https://openspace.infohio.org/static/newdesign/images/materials/default-thumbnail-index.png)
This lesson is great for young learners who like to collect things. It gives you ideas of ways to teach such concepts as classifying, sorting, arranging, multiplying, graphing, and measuring with collections of simple objects.

CK-12 Foundation's Trigonometry FlexBook is an introduction to trigonometry for the high school student. Topics include: Trigonometric Identities & Equations, Circular Functions, and Polar Equations & Complex Numbers.

CK-12's Texas Instruments Trigonometry Student Edition Flexbook is a helpful companion to a trigonometry course, providing students with more ways to understand basic trigonometric concepts through supplementary exercises and explanations.

CK-12's Texas Instruments Trigonometry Teacher's Edition Flexbook is a helpful companion to a trigonometry course, providing students with more ways to understand basic trigonometric concepts through supplementary exercises and explanations.

CK-12 Trigonometry Teacher's Edition provides tips and common errors for teaching CK-12 Trigonometry Student Edition. The solution and assessment guides are available upon request.

Students build on their existing air quality knowledge and a description of a data set to each develop a hypothesis around how and why air pollutants vary on a daily and seasonal basis. Then they are guided by a worksheet through an Excel-based analysis of the data. This includes entering formulas to calculate statistics and creating plots of the data. As students complete each phase of the analysis, reflection questions guide their understanding of what new information the analysis reveals. At activity end, students evaluate their original hypotheses and “put all of the pieces together.” The activity includes one carbon dioxide worksheet/data set and one ozone worksheet/data set; providing students and/or instructors with a content option. The activity also serves as a good standalone introduction to using Excel.

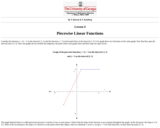
Piecewise linear functions are presented with examples and definitions. See how piecewise functions are applied to real-world situations through an example with income taxes.

A solution is presented to a student-submitted problem. The problem involves graphing and finding the solution set to a system of inequalities.
![Univ. of Waterloo: Wired Math: Linear Graphing: Graphing and Analyzing [PDF]](https://openspace.infohio.org/static/newdesign/images/materials/default-thumbnail-index.png)
The mathematics resource assesses students on linear relations. The activity has problems with graphing and analyzing linear relations. Some of the topics included are variation, scatter plots and linear relationships. The worksheet has problems, challenge activities, and an extension activity.

In this interactive, students use logic and mathematical skill to place animals at the correct points on a Cartesian graph representing the cardinal directions. Then, they use the Pythagorean theorem to determine the distances between points. The riddles in the interactive, including one requiring an understanding of rate, have randomized values so that students can place points at different locations and calculate different distances. The activity provides a review of concepts related to determining the distances between points on a Cartesian graph using the Pythagorean theorem and a response sheet to help students work with the interactive.

Find a quick, concise explanation of how to graph a one variable inequality. An example is given and clearly explained.

Find a quick, concise explanation of hyperbolas. An example is given and clearly explained.

To graph a function, you first need a table of values to fit your equation. This video will demonstrate how to make a table and then plot those values to make a graph. [3:23]

See how to graph a function by making a table of values that fir your equation. [3:24]

The intersection of two inequalities is what they have in common. This tutorial shows you how to graph two inequalities on the same number line and then find the intersection. [2:40]

To graph a linear equation, you first need to make a table of values to plot. This tutorial will teach you how to set up this table of values using an example. [5:41]

Check out this tutorial to see how to solve a system of linear equations by graphing both lines and finding their intersection. [4:01]