Remaining groups present their unit projects. Students discuss teacher and peer feedback.Key …
Remaining groups present their unit projects. Students discuss teacher and peer feedback.Key ConceptsThe unit project serves as the final assessment. Students should demonstrate their understanding of unit concepts:Measures of center (mean, median, mode) and spread (MAD, range, interquartile range)The five-number summary and its relationship to box plotsRelationship between data sets and line plots, box plots, and histogramsAdvantages and disadvantages of portraying data in line plots, box plots, and histogramsGoals and Learning ObjectivesPresent projects and demonstrate an understanding of the unit concepts.Provide feedback for others' presentations.Review the concepts from the unit.Review presentation feedback and reflect.
GalleryCreate a Data SetStudents will create data sets with a specified mean, …
GalleryCreate a Data SetStudents will create data sets with a specified mean, median, range, and number of data values.Bouncing Ball Experiment How high does the class think a typical ball bounces (compared to its drop height) on its first bounce? Students will conduct an experiment to find out.Adding New Data to a Data Set Given a data set, students will explore how the mean changes as they add data values.Bowling Scores Students will create bowling score data sets that meet certain criteria with regard to measures of center.Mean Number of Fillings Ten people sit in a dentist's waiting room. The mean number of fillings they have in their teeth is 4, yet none of them actually have 4 fillings. Students will explain how this situation is possible.Forestland Students will examine and interpret box plots that show the percentage of forestland in 20 European countries.What's My Data?Students will create a data set that fits a given histogram and then adjust the data set to fit additional criteria.What's My Data 2? Students will create a data set that fits a given box plot and then adjust the data set to fit additional criteria.Compare Graphs Students will make a box plot and a histogram that are based on a given line plot and then compare the three graphs to decide which one best represents the data.Random Numbers What would a data set of randomly generated numbers look like when represented on a histogram? Students will find out!No Telephone? The U.S. Census Bureau provides state-by-state data about the number of households that do not have telephones. Students will examine two box plots that show census data from 1960 and 1990 and compare and analyze the data.Who Is Taller?Who is taller—the boys in the class or the girls in the class? Students will find out by separating the class height data gathered earlier into data for boys and data for girls.
In this lesson, students are given criteria about measures of center, and …
In this lesson, students are given criteria about measures of center, and they must create line plots for data that meet the criteria. Students also explore the effect on the median and the mean when values are added to a data set.Students use a tool that shows a line plot where measures of center are shown. Students manipulate the graph and observe how the measures are affected. Students explore how well each measure describes the data and discover that the mean is affected more by extreme values than the mode or median. The mathematical definitions for measures of center and spread are formalized.Key ConceptsStudents use the Line Plot with Stats interactive to develop a greater understanding of the measures of center. Here are a few of the things students may discover:The mean and the median do not have to be data points.The mean is affected by extreme values, while the median is not.Adding values above the mean increases the mean. Adding values below the mean decreases the mean.You can add values above and below the mean without changing the mean, as long as those points are “balanced.”Adding values above the median may or may not increase the median. Adding values below the median may or may not decrease the median.Adding equal numbers of points above and below the median does not change the median.The measures of center can be related in any number of ways. For example, the mean can be greater than the median, the median can be greater than the mean, and the mode can be greater than or less than either of these measures.Note: In other courses, students will learn that a set of data may have more than one mode. That will not be the case in this lesson.Goals and Learning ObjectivesExplore how changing the data in a line plot affects the measures of center (mean, median).Understand that the mean is affected by outliers more than the median is.Create line plots that fit criteria for given measures of center.
Students experience data collection, analysis and inquiry in this LEGO® MINDSTORMS® NXT …
Students experience data collection, analysis and inquiry in this LEGO® MINDSTORMS® NXT -based activity. They measure the position of an oscillating platform using a ultrasonic sensor and perform statistical analysis to determine the mean, mode, median, percent difference and percent error for the collected data.
This lesson looks at the different measures of center and variability that …
This lesson looks at the different measures of center and variability that are used when analyzing the spread of data in a distribution. Includes downloadable study guide with exercises - guide also covers other topics. [17:21]
Students connect algebra to geometric concepts with polygons as they explore the …
Students connect algebra to geometric concepts with polygons as they explore the distance formula, slope criteria for parallel and perpendicular lines, and learn to calculate and justify the area and perimeter of polygons.
Principles of Macroeconomics 2e covers the scope and sequence of most introductory …
Principles of Macroeconomics 2e covers the scope and sequence of most introductory economics courses. The text includes many current examples, which are handled in a politically equitable way. The outcome is a balanced approach to the theory and application of economics concepts. The second edition has been thoroughly revised to increase clarity, update data and current event impacts, and incorporate the feedback from many reviewers and adopters. Changes made in Principles of Macroeconomics 2e are described in the preface and the transition guide to help instructors transition to the second edition. The first edition of Principles of Macroeconomics by OpenStax is available in web view here.
Watch and listen as the assistant general manager of a major league …
Watch and listen as the assistant general manager of a major league baseball team explains how he uses math in this video from KAET, Arizona PBS. A lesson plan and handouts are included. [7:43]
Students apply pre-requisite statistics knowledge and concepts learned in an associated lesson …
Students apply pre-requisite statistics knowledge and concepts learned in an associated lesson to a real-world state-of-the-art research problem that asks them to quantitatively analyze the effectiveness of different cracked steel repair methods. As if they are civil engineers, students statistically analyze and compare 12 sets of experimental data from seven research centers around the world using measurements of central tendency, five-number summaries, box-and-whisker plots and bar graphs. The data consists of the results from carbon-fiber-reinforced polymer patched and unpatched cracked steel specimens tested under the same stress conditions. Based on their findings, students determine the most effective cracked steel repair method, create a report, and present their results, conclusions and recommended methods to the class as if they were presenting to the mayor and city council. This activity and its associated lesson are suitable for use during the last six weeks of the AP Statistics course; see the topics and timing note for details.
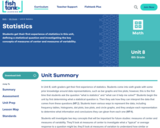
Working as if they are engineers aiming to analyze and then improve …
Working as if they are engineers aiming to analyze and then improve data collection devices for precision agriculture, students determine how accurate temperature sensors are by comparing them to each other. Teams record soil temperature data during a class period while making changes to the samples to mimic real-world crop conditions—such as the addition of water and heat and the removal of the heat. Groups analyze their collected data by finding the mean, median, mode, and standard deviation. Then, the class combines all the team data points in order to compare data collected from numerous devices and analyze the accuracy of their recording devices by finding the standard deviation of temperature readings at each minute. By averaging the standard deviations of each minute’s temperature reading, students determine the accuracy of their temperature sensors. Students present their findings and conclusions, including making recommendations for temperature sensor improvements.
Students get their first experience of statistics in this unit, defining a …
Students get their first experience of statistics in this unit, defining a statistical question and investigating the key concepts of measures of center and measures of variability.
This 4-minute video lesson explains the mean, median, and mode. [Statistics playlist: …
This 4-minute video lesson explains the mean, median, and mode. [Statistics playlist: Lesson 1 of 85]
Khan Academy learning modules include a Community space where users can ask questions and seek help from community members. Educators should consult with their Technology administrators to determine the use of Khan Academy learning modules in their classroom. Please review materials from external sites before sharing with students.
Download these free worksheets to sharpen your skills with statistics and probability. …
Download these free worksheets to sharpen your skills with statistics and probability. Sheets focus on collecting and organizing data, measures of central tendency (mean, median, mode, and range), and probability.
This resource is the beginning of a series of pages that demonstrates …
This resource is the beginning of a series of pages that demonstrates the diffference between the mean and median of a group of numbers. Uses bar graphs to display the data.
No restrictions on your remixing, redistributing, or making derivative works. Give credit to the author, as required.
Your remixing, redistributing, or making derivatives works comes with some restrictions, including how it is shared.
Your redistributing comes with some restrictions. Do not remix or make derivative works.
Most restrictive license type. Prohibits most uses, sharing, and any changes.
Copyrighted materials, available under Fair Use and the TEACH Act for US-based educators, or other custom arrangements. Go to the resource provider to see their individual restrictions.