In this lesson, students use their own bodies to create bar graphs …
In this lesson, students use their own bodies to create bar graphs and do problems involving addition, subtraction, and more or less amounts. They then create their own graphs, incorporating the features of graphs that they have discussed.
This video lesson introduces and defines bar graphs, discussing their uses and …
This video lesson introduces and defines bar graphs, discussing their uses and construction. Includes several multiple-choice questions to check your understanding. [3:13]
Students use data to create a tally chart and make a bar …
Students use data to create a tally chart and make a bar graph. This lesson includes a detailed plan, videos of students engaged in the lesson, and printable worksheets.
Students love graphing data that they "own". In this plan, the class …
Students love graphing data that they "own". In this plan, the class will select a type of graph and create it using a class survey frequency table. Included in this lesson are videos of the class engaged in the lesson and samples of graphs that students created.
The students will be working in centers to review for their test. …
The students will be working in centers to review for their test. The centers will consist of a computer rotation, versa-tiles, and a teacher center. All centers will reinforce concepts learned throughout this unit to prepare them for their assessment.
In this lesson, students continue to build their graphing skills. This lesson …
In this lesson, students continue to build their graphing skills. This lesson also reinforces important mathematical skills like counting and comparing.
Demonstrates how to make bar and picture graphs and then read them. …
Demonstrates how to make bar and picture graphs and then read them. [4:57]
Khan Academy learning modules include a Community space where users can ask questions and seek help from community members. Educators should consult with their Technology administrators to determine the use of Khan Academy learning modules in their classroom. Please review materials from external sites before sharing with students.
Students analyze contextual situations, focusing on single variable data and bivariate data, …
Students analyze contextual situations, focusing on single variable data and bivariate data, and are introduced to the concept of using data to make predictions and judgments about a situation.
Try this real world challenge that focuses on data collection, data analysis, …
Try this real world challenge that focuses on data collection, data analysis, and problem solving with information from the U.S. Census Bureau. Discover how these skills are applied in real life situations in this one page activity from the NCTM Math Challenges for Families series.
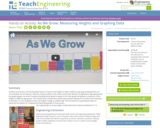
Students visit second- and fourth-grade classes to measure the heights of older …
Students visit second- and fourth-grade classes to measure the heights of older students using large building blocks as a non-standard unit of measure. They also measure adults in the school community. Results are displayed in age-appropriate bar graphs (paper cut-outs of miniature building blocks glued on paper to form bar graphs) enabling a comparison of the heights of different age groups. The activities that comprise this activity help students develop the concepts and vocabulary to describe, in a non-ambiguous way, how heights change as children age. This introduction to graphing provides an important foundation for creating and interpreting graphs in future years.
Students plant sunflower seeds in plastic cups, and once germinated, expose them …
Students plant sunflower seeds in plastic cups, and once germinated, expose them to varying light or soil moisture conditions. They measure growth of the seedlings every few days using non-standard measurement (inch cubes). After a few weeks, they compare the growth of plants exposed to the different conditions and make bar comparative graphs, which they analyze to draw conclusions about the needs of plants.
In this video from Cyberchase, the CyberSquad helps Ms. Fileshare realize that …
In this video from Cyberchase, the CyberSquad helps Ms. Fileshare realize that Hacker has been deceiving her as they take a look at the scale of a bar graph.
No restrictions on your remixing, redistributing, or making derivative works. Give credit to the author, as required.
Your remixing, redistributing, or making derivatives works comes with some restrictions, including how it is shared.
Your redistributing comes with some restrictions. Do not remix or make derivative works.
Most restrictive license type. Prohibits most uses, sharing, and any changes.
Copyrighted materials, available under Fair Use and the TEACH Act for US-based educators, or other custom arrangements. Go to the resource provider to see their individual restrictions.
![ArtsNow Learning: We Are Living Graphs and Data [PDF]](https://openspace.infohio.org/static/newdesign/images/materials/default-thumbnail-index.png)