In this exercise, students practice comparing probabilities. Students receive immediate feedback and …
In this exercise, students practice comparing probabilities. Students receive immediate feedback and have the opportunity to get hints and try questions repeatedly.
Khan Academy learning modules include a Community space where users can ask questions and seek help from community members. Educators should consult with their Technology administrators to determine the use of Khan Academy learning modules in their classroom. Please review materials from external sites before sharing with students.
This lesson [3:31] shows how to calculate the desired outcomes in a …
This lesson [3:31] shows how to calculate the desired outcomes in a probability experiment or problem. It is 2 of 8 in the series titled "Counting Desired Outcomes."
This lesson plan sets the ground work for an introduction to and …
This lesson plan sets the ground work for an introduction to and then exploring the concepts that are the foundation for probability. Lots of resources are available for teachers and students at this website.
Samples and ProbabilityType of Unit: ConceptualPrior KnowledgeStudents should be able to:Understand the …
Samples and ProbabilityType of Unit: ConceptualPrior KnowledgeStudents should be able to:Understand the concept of a ratio.Write ratios as percents.Describe data using measures of center.Display and interpret data in dot plots, histograms, and box plots.Lesson FlowStudents begin to think about probability by considering the relative likelihood of familiar events on the continuum between impossible and certain. Students begin to formalize this understanding of probability. They are introduced to the concept of probability as a measure of likelihood, and how to calculate probability of equally likely events using a ratio. The terms (impossible, certain, etc.) are given numerical values. Next, students compare expected results to actual results by calculating the probability of an event and conducting an experiment. Students explore the probability of outcomes that are not equally likely. They collect data to estimate the experimental probabilities. They use ratio and proportion to predict results for a large number of trials. Students learn about compound events. They use tree diagrams, tables, and systematic lists as tools to find the sample space. They determine the theoretical probability of first independent, and then dependent events. In Lesson 10 students identify a question to investigate for a unit project and submit a proposal. They then complete a Self Check. In Lesson 11, students review the results of the Self Check, solve a related problem, and take a Quiz.Students are introduced to the concept of sampling as a method of determining characteristics of a population. They consider how a sample can be random or biased, and think about methods for randomly sampling a population to ensure that it is representative. In Lesson 13, students collect and analyze data for their unit project. Students begin to apply their knowledge of statistics learned in sixth grade. They determine the typical class score from a sample of the population, and reason about the representativeness of the sample. Then, students begin to develop intuition about appropriate sample size by conducting an experiment. They compare different sample sizes, and decide whether increasing the sample size improves the results. In Lesson 16 and Lesson 17, students compare two data sets using any tools they wish. Students will be reminded of Mean Average Deviation (MAD), which will be a useful tool in this situation. Students complete another Self Check, review the results of their Self Check, and solve additional problems. The unit ends with three days for students to work on Gallery problems, possibly using one of the days to complete their project or get help on their project if needed, two days for students to present their unit projects to the class, and one day for the End of Unit Assessment.
Students begin to formalize their understanding of probability. They are introduced to …
Students begin to formalize their understanding of probability. They are introduced to the concept of probability as a measure of likelihood and how to calculate probability as a ratio. The terms discussed (impossible, certain, etc.) in Lesson 1 are given numerical values.Key ConceptsStudents will think of probability as a ratio; it can be written as a fraction, decimal, or a percent ranging from 0 to 1.Students will think about ratio and proportion to predict results.Goals and Learning ObjectivesDefine probability as a measure of likelihood and the ratio of favorable outcomes to the total number of outcomes for an event.Predict results based on theoretical probability using ratio and proportion.
Students will begin to think about probability by considering how likely it …
Students will begin to think about probability by considering how likely it is that their house will be struck by lightning. They will consider the relative likelihood of familiar events (e.g., outdoor temperature, test scores) on the continuum between impossible and certain. Students will discuss where on the continuum "likely," "unlikely," and "equally likely as unlikely" are.Key ConceptsAs students begin their study of probability, they look at the likelihood of events. Students have an intuitive sense of likelihood, even if no numbers or ratios are attached to the events. For example, there is clearly a better chance that a specific student will be chosen at random from a class than from the entire school.Goals and Learning ObjectivesThink about the concept of likelihood.Understand that probability is a measure of likelihood.Informally estimate the likelihood of certain events.Begin to think about why one event is more likely than another.SWD: Students with disabilities may need additional support seeing the relationships among problems and strategies. Throughout this unit, keep anchor charts available and visible to assist them in making connections and working toward mastery. Provide explicit think alouds comparing strategies and making connections. In addition, ask probing questions to get students to articulate how a peer solved the problem or how one strategy or visual representation is connected or related to another.
Come on down! You are the next contestant on the Price is …
Come on down! You are the next contestant on the Price is Right! Play Plinko and learn about probability at the same time! Teacher Resources requires creating free login.
Students have their first encounter with probability, as they develop their understanding …
Students have their first encounter with probability, as they develop their understanding of probability through calculating theoretical probabilities and designing and running their own simulations.
This site from Richland Community College provides an overview of probability including …
This site from Richland Community College provides an overview of probability including a list of probability rules. Several examples using dice are included.
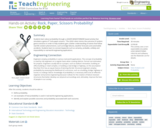
Students learn about probability through a LEGO® MINDSTORMS® NTX-based activity that simulates …
Students learn about probability through a LEGO® MINDSTORMS® NTX-based activity that simulates a game of "rock-paper-scissors." The LEGO robot mimics the outcome of random game scenarios in order to help students gain a better understanding of events that follow real-life random phenomenon, such as bridge failures, weather forecasts and automobile accidents. Students learn to connect keywords such as certainty, probable, unlikely and impossibility to real-world engineering applications.
No restrictions on your remixing, redistributing, or making derivative works. Give credit to the author, as required.
Your remixing, redistributing, or making derivatives works comes with some restrictions, including how it is shared.
Your redistributing comes with some restrictions. Do not remix or make derivative works.
Most restrictive license type. Prohibits most uses, sharing, and any changes.
Copyrighted materials, available under Fair Use and the TEACH Act for US-based educators, or other custom arrangements. Go to the resource provider to see their individual restrictions.