Conditional Remix & Share Permitted
CC BY-NC
- Subject:
- Mathematics
- Material Type:
- Full Course
- Provider:
- Pearson
- Date Added:
- 02/28/2022

Algebraic Reasoning
Type of Unit: Concept
Prior Knowledge
Students should be able to:
Add, subtract, multiply, and divide rational numbers.
Evaluate expressions for a value of a variable.
Use the distributive property to generate equivalent expressions including combining like terms.
Understand solving an equation or inequality as a process of answering a question: which values from a specified set, if any, make the equation or inequality true?
Write and solve equations of the form x+p=q and px=q for cases in which p, q, and x are non-negative rational numbers.
Understand and graph solutions to inequalities x<c or x>c.
Use equations, tables, and graphs to represent the relationship between two variables.
Relate fractions, decimals, and percents.
Solve percent problems included those involving percent of increase or percent of decrease.
Lesson Flow
This unit covers all of the Common Core State Standards for Expressions and Equations in Grade 7. Students extend what they learned in Grade 6 about evaluating expressions and using properties to write equivalent expressions. They write, evaluate, and simplify expressions that now contain both positive and negative rational numbers. They write algebraic expressions for problem situations and discuss how different equivalent expressions can be used to represent different ways of solving the same problem. They make connections between various forms of rational numbers. Students apply what they learned in Grade 6 about solving equations such as x+2=6 or 3x=12 to solving equations such as 3x+6=12 and 3(x−2)=12. Students solve these equations using formal algebraic methods. The numbers in these equations can now be rational numbers. They use estimation and mental math to estimate solutions. They learn how solving linear inequalities differs from solving linear equations and then they solve and graph linear inequalities such as −3x+4<12. Students use inequalities to solve real-world problems, solving the problem first by arithmetic and then by writing and solving an inequality. They see that the solution of the algebraic inequality may differ from the solution to the problem.

Gallery OverviewAllow students who have a clear understanding of the content thus far in the unit to work on Gallery problems of their choosing. You can then use this time to provide additional help to students who need review of the unit's concepts or to assist students who may have fallen behind on work.Gallery DescriptionsFlight of the AlbatrossStudents use estimation to learn about the distances albatrosses fly.SalesStudents use equivalent expressions to solve two-step percent of increase or percent of decrease problems in one step.Carpet CleaningStudents write and solve equations to model the relationship between hours worked and the cost of carpet cleaning.Equations About NumbersStudents write an equation to solve a problem about the sum of three consecutive numbers. Then they write and solve their own problem about the sum of three consecutive numbers.Equations About SportsStudents write and solve equations to solve problems about a basketball game and about walking versus bicycling.Equations About FiguresStudents write and solve equations to model the side lengths and areas of rectangles.A Number TrickStudents use what they know about simplifying algebraic expressions to do number tricks.

Proportional Relationships
Type of Unit: Concept
Prior Knowledge
Students should be able to:
Understand what a rate and ratio are.
Make a ratio table.
Make a graph using values from a ratio table.
Lesson Flow
Students start the unit by predicting what will happen in certain situations. They intuitively discover they can predict the situations that are proportional and might have a hard time predicting the ones that are not. In Lessons 2–4, students use the same three situations to explore proportional relationships. Two of the relationships are proportional and one is not. They look at these situations in tables, equations, and graphs. After Lesson 4, students realize a proportional relationship is represented on a graph as a straight line that passes through the origin. In Lesson 5, they look at straight lines that do not represent a proportional relationship. Lesson 6 focuses on the idea of how a proportion that they solved in sixth grade relates to a proportional relationship. They follow that by looking at rates expressed as fractions, finding the unit rate (the constant of proportionality), and then using the constant of proportionality to solve a problem. In Lesson 8, students fine-tune their definition of proportional relationship by looking at situations and determining if they represent proportional relationships and justifying their reasoning. They then apply what they have learned to a situation about flags and stars and extend that thinking to comparing two prices—examining the equations and the graphs. The Putting It Together lesson has them solve two problems and then critique other student work.
Gallery 1 provides students with additional proportional relationship problems.
The second part of the unit works with percents. First, percents are tied to proportional relationships, and then students examine percent situations as formulas, graphs, and tables. They then move to a new context—salary increase—and see the similarities with sales taxes. Next, students explore percent decrease, and then they analyze inaccurate statements involving percents, explaining why the statements are incorrect. Students end this sequence of lessons with a formative assessment that focuses on percent increase and percent decrease and ties it to decimals.
Students have ample opportunities to check, deepen, and apply their understanding of proportional relationships, including percents, with the selection of problems in Gallery 2.

Students are asked whether they can determine the number of books in a stack by measuring the height of the stack, or the number of marbles in a collection of marbles by weighing the collection.Students are asked to identify for which situations they can determine the number of books in a stack of books by measuring the height of the stack or the number of marbles in a collection of marbles by weighing the collection.Key ConceptsAs students examine different numerical relationships, they come to understand that they can find the number of books or the number of marbles in situations in which the books are all the same thickness and the marbles are all the same weight. This “constant” is equal to the value BA for a ratio A : B; students begin to develop an intuitive understanding of proportional relationships.Goals and Learning ObjectivesExplore numerical relationshipsSWD: Some students with disabilities will benefit from a preview of the goals in each lesson. Have students highlight the critical features or concepts to help them pay close attention to salient information.

Samples and ProbabilityType of Unit: ConceptualPrior KnowledgeStudents should be able to:Understand the concept of a ratio.Write ratios as percents.Describe data using measures of center.Display and interpret data in dot plots, histograms, and box plots.Lesson FlowStudents begin to think about probability by considering the relative likelihood of familiar events on the continuum between impossible and certain. Students begin to formalize this understanding of probability. They are introduced to the concept of probability as a measure of likelihood, and how to calculate probability of equally likely events using a ratio. The terms (impossible, certain, etc.) are given numerical values. Next, students compare expected results to actual results by calculating the probability of an event and conducting an experiment. Students explore the probability of outcomes that are not equally likely. They collect data to estimate the experimental probabilities. They use ratio and proportion to predict results for a large number of trials. Students learn about compound events. They use tree diagrams, tables, and systematic lists as tools to find the sample space. They determine the theoretical probability of first independent, and then dependent events. In Lesson 10 students identify a question to investigate for a unit project and submit a proposal. They then complete a Self Check. In Lesson 11, students review the results of the Self Check, solve a related problem, and take a Quiz.Students are introduced to the concept of sampling as a method of determining characteristics of a population. They consider how a sample can be random or biased, and think about methods for randomly sampling a population to ensure that it is representative. In Lesson 13, students collect and analyze data for their unit project. Students begin to apply their knowledge of statistics learned in sixth grade. They determine the typical class score from a sample of the population, and reason about the representativeness of the sample. Then, students begin to develop intuition about appropriate sample size by conducting an experiment. They compare different sample sizes, and decide whether increasing the sample size improves the results. In Lesson 16 and Lesson 17, students compare two data sets using any tools they wish. Students will be reminded of Mean Average Deviation (MAD), which will be a useful tool in this situation. Students complete another Self Check, review the results of their Self Check, and solve additional problems. The unit ends with three days for students to work on Gallery problems, possibly using one of the days to complete their project or get help on their project if needed, two days for students to present their unit projects to the class, and one day for the End of Unit Assessment.

Students estimate the length of 20 seconds by starting an unseen timer and stopping it when they think 20 seconds has elapsed. They are shown the results and repeat the process two more times. The first and third times are recorded and compiled, producing two data sets to be compared. Students analyze the data to conclude whether or not their ability to estimate 20 seconds improves with practice.Key ConceptsMeasures of center and spreadLine plots, box plots, and histogramsMean absolute deviation (MAD)Goals and Learning ObjectivesApply knowledge of statistics to compare sets of data.Use measures of center and spread to analyze data.Decide which graph is appropriate for a given situation.

This page gives a description of the Spearman Rank Correlation Coefficient, which is an approximation to the exact correlation coefficient, r. It is somewhat easier to compute than the exact correlation coefficient. Also provides links to definitions that could be helpful in understanding the information on this page.
Demonstrates how to make reasonable estimates using multiplication and division. [2:10]
Khan Academy learning modules include a Community space where users can ask questions and seek help from community members. Educators should consult with their Technology administrators to determine the use of Khan Academy learning modules in their classroom. Please review materials from external sites before sharing with students.
This interactive game has students apply skills in estimation, measurement, and basic addition using pearls. Students are asked to estimate the number of pearls in a treasure chest by making predictions and using number sense. The skills are appropriate for students in grades th3-5. Additional features include links to related history, lesson plans, and articles on pearls. CCSS.Math.Content.3.MD.A.2 Measure and estimate liquid volumes and masses of objects using standard units
Estimate how many pennies a flatboat made of aluminum foil will hold, then test your hypothesis.
Explore size estimation in one, two, and three dimensions! Multiple levels of difficulty allow for progressive skill improvement.
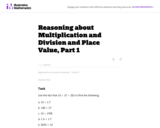
The three tasks in this set are not examples of tasks asking students to compute using the standard algorithms for multiplication and division because most people know what those kinds of problems look like. Instead, these tasks show what kinds of reasoning and estimation strategies students need to develop in order to support their algorithmic computations.
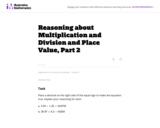
The three tasks (including part 1 and part 3) in this set are not examples of tasks asking students to compute using the standard algorithms for multiplication and division because most people know what those kinds of problems look like. Instead, these tasks show what kinds of reasoning and estimation strategies students need to develop in order to support their algorithmic computations.
Brush up on your math skills relating to rounding numbers then try some practice problems to test your understanding.
In this adapted ZOOM video segment, cast members calculate how much water they each use during a typical shower. They compare their results to their original predictions.
Students "go fishing" and use proportions to learn how estimating is used to determine the size of a population.
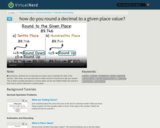
Find out how to round a decimal to a given place value. [4:28]
Oscar estimates the size of a very large number and counts by hundreds as he shows off the Odd Squad Ball Room.
Students learn about trigonometry, geometry and measurements while participating in a hands-on interaction with LEGO® MINDSTORMS® NXT technology. First they review fundamental geometrical and trigonometric concepts. Then, they estimate the height of various objects by using simple trigonometry. Students measure the height of the objects using the LEGO robot kit, giving them an opportunity to see how sensors and technology can be used to measure things on a larger scale. Students discover that they can use this method to estimate the height of buildings, trees or other tall objects. Finally, students synthesize their knowledge by applying it to solve similar problems. By activity end, students have a better grasp of trigonometry and its everyday applications.