This learning video continues the theme of an early BLOSSOMS lesson, Flaws …
This learning video continues the theme of an early BLOSSOMS lesson, Flaws of Averages, using new example- including how all the children from Lake Wobegon can be above average, as well as the Friendship Paradox. The objective of this module, is to simply point out a few pitfalls that could arise if one is not attentive to details when calculating and interpreting averages. [22:41]
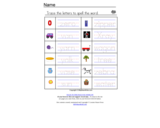
This site provides a simple one-page exercise that lets students trace letters …
This site provides a simple one-page exercise that lets students trace letters to spell words, such as zebra and the sun. Reinforces the connection between words and their sounds and how words are spelled. Corresponding pictures and recognition.
A detailed source for professional editing and proofreading strategies. Links on the …
A detailed source for professional editing and proofreading strategies. Links on the right offer several pages of text for both editing and proofreading, including guidelines and samples for each.
A basic guide concerning how to go about publishing your writing. Includes …
A basic guide concerning how to go about publishing your writing. Includes information about what it means to be published, publication types, and guidelines for submission. CCSS.ELA-Literacy.CCRA.W.6
This resource explores the various types and uses of descriptions in writing. …
This resource explores the various types and uses of descriptions in writing. Includes in-depth information about the definition, uses, and types of descriptive detail.
This website offers a clear definition of the science of Genetics, highlighting …
This website offers a clear definition of the science of Genetics, highlighting DNA and genes. There is a neat, easy-to-understand animated tour of the basics and an opportunity to go inside an animated cell. Student can build a DNA molecule and discover how proteins function. Teachers and students alike will enjoy "What Makes a Firefly Glow?" Among others, there is a student activity based on using DNA to solve a mystery of stolen artifacts. The great teacher resources supply guides and suggest classroom activities. All in all, this is a useful site whose simple interactive graphics provide a fun and easy way to learn the difficult subject of DNA.
Distributions and Variability Type of Unit: Project Prior Knowledge Students should be …
Distributions and Variability
Type of Unit: Project
Prior Knowledge
Students should be able to:
Represent and interpret data using a line plot. Understand other visual representations of data.
Lesson Flow
Students begin the unit by discussing what constitutes a statistical question. In order to answer statistical questions, data must be gathered in a consistent and accurate manner and then analyzed using appropriate tools.
Students learn different tools for analyzing data, including:
Measures of center: mean (average), median, mode Measures of spread: mean absolute deviation, lower and upper extremes, lower and upper quartile, interquartile range Visual representations: line plot, box plot, histogram
These tools are compared and contrasted to better understand the benefits and limitations of each. Analyzing different data sets using these tools will develop an understanding for which ones are the most appropriate to interpret the given data.
To demonstrate their understanding of the concepts, students will work on a project for the duration of the unit. The project will involve identifying an appropriate statistical question, collecting data, analyzing data, and presenting the results. It will serve as the final assessment.
Students will apply what they have learned in previous lessons to analyze …
Students will apply what they have learned in previous lessons to analyze and draw conclusions about a set of data. They will also justify their thinking based on what they know about the measures (e.g., I know the mean is a good number to use to describe what is typical because the range is narrow and so the MAD is low.).Students analyze one of the data sets about the characteristics of sixth grade students that was collected by the class in Lesson 2. Students construct line plots and calculate measures of center and spread in order to further their understanding of the characteristics of a typical sixth grade student.Key ConceptsNo new mathematical ideas are introduced in this lesson. Instead, students apply the skills they have acquired in previous lessons to analyze a data set for one attribute of a sixth grade student. Students make a line plot of the data and find the mean, median, range, MAD, and outliers. They use these results to determine a typical value for their data.Goals and Learning ObjectivesDescribe an attribute of a typical sixth grade student using line plots and measures of center (mean and median) and spread (range and MAD).Justify thinking about which measures are good descriptors of the data set.
In this lesson, students are given criteria about measures of center, and …
In this lesson, students are given criteria about measures of center, and they must create line plots for data that meet the criteria. Students also explore the effect on the median and the mean when values are added to a data set.Students use a tool that shows a line plot where measures of center are shown. Students manipulate the graph and observe how the measures are affected. Students explore how well each measure describes the data and discover that the mean is affected more by extreme values than the mode or median. The mathematical definitions for measures of center and spread are formalized.Key ConceptsStudents use the Line Plot with Stats interactive to develop a greater understanding of the measures of center. Here are a few of the things students may discover:The mean and the median do not have to be data points.The mean is affected by extreme values, while the median is not.Adding values above the mean increases the mean. Adding values below the mean decreases the mean.You can add values above and below the mean without changing the mean, as long as those points are “balanced.”Adding values above the median may or may not increase the median. Adding values below the median may or may not decrease the median.Adding equal numbers of points above and below the median does not change the median.The measures of center can be related in any number of ways. For example, the mean can be greater than the median, the median can be greater than the mean, and the mode can be greater than or less than either of these measures.Note: In other courses, students will learn that a set of data may have more than one mode. That will not be the case in this lesson.Goals and Learning ObjectivesExplore how changing the data in a line plot affects the measures of center (mean, median).Understand that the mean is affected by outliers more than the median is.Create line plots that fit criteria for given measures of center.
NASA's Glenn Research Center "develops advanced technology for high priority national needs …
NASA's Glenn Research Center "develops advanced technology for high priority national needs - propulsion, power, and communications technologies for application to aeronautics and space."
NASA's Johnson Space Center is located near Houston, Texas and was constructed …
NASA's Johnson Space Center is located near Houston, Texas and was constructed as "the primary center for: design, development testing of spacecraft and associated systems for human flight; selection and training of astronauts; planning and conducting human space flight missions; and extensive participation in the medical, engineering scientific experiments carried aboard space flights."
This resource provides a summary of the Clean Water Act and sections …
This resource provides a summary of the Clean Water Act and sections such as background, federal and state responsibilities, regulations, enforcement, and major amendments are provided.
No restrictions on your remixing, redistributing, or making derivative works. Give credit to the author, as required.
Your remixing, redistributing, or making derivatives works comes with some restrictions, including how it is shared.
Your redistributing comes with some restrictions. Do not remix or make derivative works.
Most restrictive license type. Prohibits most uses, sharing, and any changes.
Copyrighted materials, available under Fair Use and the TEACH Act for US-based educators, or other custom arrangements. Go to the resource provider to see their individual restrictions.