New activities designed specifically for the 2019-2020 school year spotlight the 2020 …
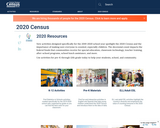
New activities designed specifically for the 2019-2020 school year spotlight the 2020 Census and the importance of making sure everyone is counted, especially children. The decennial count impacts the federal funds that communities receive for special education, classroom technology, teacher training, after-school programs, school lunch assistance, and more. PreK-grade 12.
AAA Math's interactive tutorials and lessons assist students grades K-8 improve their …
AAA Math's interactive tutorials and lessons assist students grades K-8 improve their understanding of a wide range of arithmetic topics. Students are provided with immediate feedback as they complete the "Learn," "Practice," and "Play" portions of each lesson. Browse AAA Math's contents by subject or by grade level.
Students build a formal understanding of probability, considering complex events such as …
Students build a formal understanding of probability, considering complex events such as unions, intersections, and complements as well as the concept of independence and conditional probability. The idea of using a smooth curve to model a data distribution is introduced along with using tables and technology to find areas under a normal curve. Students make inferences and justify conclusions from sample surveys, experiments, and observational studies. Data is used from random samples to estimate a population mean or proportion. Students calculate margin of error and interpret it in context. Given data from a statistical experiment, students use simulation to create a randomization distribution and use it to determine if there is a significant difference between two treatments.
Find the rest of the EngageNY Mathematics resources at https://archive.org/details/engageny-mathematics.
(Nota: Esta es una traducción de un recurso educativo abierto creado por …
(Nota: Esta es una traducción de un recurso educativo abierto creado por el Departamento de Educación del Estado de Nueva York (NYSED) como parte del proyecto "EngageNY" en 2013. Aunque el recurso real fue traducido por personas, la siguiente descripción se tradujo del inglés original usando Google Translate para ayudar a los usuarios potenciales a decidir si se adapta a sus necesidades y puede contener errores gramaticales o lingüísticos. La descripción original en inglés también se proporciona a continuación.)
Los estudiantes crean una comprensión formal de la probabilidad, considerando eventos complejos como sindicatos, intersecciones y complementos, así como el concepto de independencia y probabilidad condicional. La idea de usar una curva suave para modelar una distribución de datos se introduce junto con el uso de tablas y tecnología para encontrar áreas bajo una curva normal. Los estudiantes hacen inferencias y justifican conclusiones de encuestas de muestra, experimentos y estudios de observación. Los datos se usan de muestras aleatorias para estimar una media o proporción de población. Los estudiantes calculan el margen de error y lo interpretan en contexto. Dados los datos de un experimento estadístico, los estudiantes usan la simulación para crear una distribución de aleatorización y lo usan para determinar si hay una diferencia significativa entre dos tratamientos.
Encuentre el resto de los recursos matemáticos de Engageny en https://archive.org/details/engageny-mathematics.
English Description: Students build a formal understanding of probability, considering complex events such as unions, intersections, and complements as well as the concept of independence and conditional probability. The idea of using a smooth curve to model a data distribution is introduced along with using tables and technology to find areas under a normal curve. Students make inferences and justify conclusions from sample surveys, experiments, and observational studies. Data is used from random samples to estimate a population mean or proportion. Students calculate margin of error and interpret it in context. Given data from a statistical experiment, students use simulation to create a randomization distribution and use it to determine if there is a significant difference between two treatments.
Find the rest of the EngageNY Mathematics resources at https://archive.org/details/engageny-mathematics.
Measuring the dimensions of nano-circuits requires an expensive, high-resolution microscope with integrated …
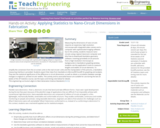
Measuring the dimensions of nano-circuits requires an expensive, high-resolution microscope with integrated video camera and a computer with sophisticated imaging software, but in this activity, students measure nano-circuits using a typical classroom computer and (the free-to-download) GeoGebra geometry software. Inserting (provided) circuit pictures from a high-resolution microscope as backgrounds in GeoGebra's graphing window, students use the application's tools to measure lengths and widths of circuit elements. To simplify the conversion from the on-screen units to the real circuits' units and the manipulation of the pictures, a GeoGebra measuring interface is provided. Students export their data from GeoGebra to Microsoft® Excel® for graphing and analysis. They test the statistical significance of the difference in circuit dimensions, as well as obtain a correlation between average changes in original vs. printed circuits' widths. This activity and its associated lesson are suitable for use during the last six weeks of the AP Statistics course; see the topics and timing note below for details.
This website from the BBC is a great introduction to averages (mean, …
This website from the BBC is a great introduction to averages (mean, median, and mode) and will take you through some interactive learning activities. A practice test and worksheet are also provided.
Beginning econometrics students often have an uneven preparation in statistics. The simulation …
Beginning econometrics students often have an uneven preparation in statistics. The simulation gives students a clearer understanding of the behavior of OLS estimators.
What makes a question a statistical question? Students learn about statistical and …
What makes a question a statistical question? Students learn about statistical and non-statistical questions and then use that knowledge to brainstorm survey questions for their classmates.
Students learn about statistics and the process of doing statistics as an …
Students learn about statistics and the process of doing statistics as an introduction to the 100 Students Project they will conduct about themselves and their classmates.
In this lesson, students continue to build their graphing skills. This lesson …
In this lesson, students continue to build their graphing skills. This lesson also reinforces important mathematical skills like counting and comparing.
Understanding multiple attributes is an important mathematical process. The students use their …
Understanding multiple attributes is an important mathematical process. The students use their knowledge of Venn Diagrams in this lesson to gain more knowledge about this concept.
Students act as R&D entrepreneurs, learning ways to research variables affecting the …
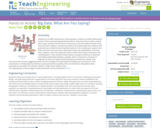
Students act as R&D entrepreneurs, learning ways to research variables affecting the market of their proposed (hypothetical) products. They learn how to obtain numeric data using a variety of Internet tools and resources, sort and analyze the data using Excel and other software, and discover patterns and relationships that influence and guide decisions related to launching their products. First, student pairs research and collect pertinent consumer data, importing the data into spreadsheets. Then they clean, organize, chart and analyze the data to inform their product production and marketing plans. They calculate related statistics and gain proficiency in obtaining and finding relationships between variables, which is important in the work of engineers as well as for general technical literacy and decision-making. They summarize their work by suggesting product launch strategies and reporting their findings and conclusions in class presentations. A finding data tips handout, project/presentation grading rubric and alternative self-guided activity worksheet are provided. This activity is ideal for a high school statistics class.
The Current Population Survey (CPS) is a monthly survey of households conducted …
The Current Population Survey (CPS) is a monthly survey of households conducted by the Bureau of Census for the Bureau of Labor Statistics. It provides a comprehensive body of data on the labor force, employment, unemployment, and persons not in the labor force. Provides general information along with detailed statistics, charts, and tables.
Compares occupations in terms of numbers employed, projected employment growth, earnings, education …
Compares occupations in terms of numbers employed, projected employment growth, earnings, education and training requirements, opportunities for self-employment and part-time work, and unemployment rate.
No restrictions on your remixing, redistributing, or making derivative works. Give credit to the author, as required.
Your remixing, redistributing, or making derivatives works comes with some restrictions, including how it is shared.
Your redistributing comes with some restrictions. Do not remix or make derivative works.
Most restrictive license type. Prohibits most uses, sharing, and any changes.
Copyrighted materials, available under Fair Use and the TEACH Act for US-based educators, or other custom arrangements. Go to the resource provider to see their individual restrictions.