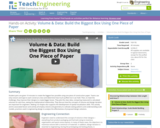
Student pairs are given 10 minutes to create the biggest box possible …
Student pairs are given 10 minutes to create the biggest box possible using one piece of construction paper. Teams use only scissors and tape to each construct a box and determine how much puffed rice it can hold. Then, to meet the challenge, they improve their designs to create bigger boxes. They plot the class data, comparing measured to calculated volumes for each box, seeing the mathematical relationship. They discuss how the concepts of volume and design iteration are important for engineers. Making 3-D shapes also supports the development of spatial visualization skills. This activity and its associated lesson and activity all employ volume and geometry to cultivate seeing patterns and understanding scale models, practices used in engineering design to analyze the effectiveness of proposed design solutions.
This video lesson demonstrates how to calculate the area of a triangle. …
This video lesson demonstrates how to calculate the area of a triangle. It includes detailed examples including ones that use the Pythagorean Theorem. Students can check their understanding with an assessment. [10:43]
Students apply their knowledge of linear regression and design to solve a …
Students apply their knowledge of linear regression and design to solve a real-world challenge to create a better packing solution for shipping cell phones. They use different materials, such as cardboard, fabric, plastic, and rubber bands to create new “composite material” packaging containers. Teams each create four prototypes made of the same materials and constructed in the same way, with the only difference being their weights, so each one is fabricated with a different amount of material. They test the three heavier prototype packages by dropping them from different heights to see how well they protect a piece of glass inside (similar in size to iPhone 6). Then students use linear regression to predict from what height they can drop the fourth/final prototype of known mass without the “phone” breaking. Success is not breaking the glass but not underestimating the height by too much either, which means using math to accurately predict the optimum drop height.
If you like tackling formulas, then this math challenge is for you. …
If you like tackling formulas, then this math challenge is for you. See if you can calculate Helix's BMI (body mass index) and find out if his health is at risk. A one page NCTM Math Challenges for Families activity that engages learners in real-world skills.
Students explore measurements of geometric figures in two-and three-dimensions, finding area, surface …
Students explore measurements of geometric figures in two-and three-dimensions, finding area, surface area, and volume in mathematical and real-world problems.
Kindergartners measure each other's height using large building blocks, then visit a …
Kindergartners measure each other's height using large building blocks, then visit a 2nd and a 4th grade class to measure those students. They can also measure adults in the school community. Results are displayed in age-appropriate bar graphs (paper cut-outs of miniature building blocks glued on paper to form a bar graph) comparing the different age groups. The activities that comprise this lesson help students develop the concepts and vocabulary to describe, in a non-ambiguous way, how height changes as children get older. The introduction to graphing provides an important foundation for both creating and interpreting graphs in future years.
Engineers create and use new materials, as well as new combinations of …
Engineers create and use new materials, as well as new combinations of existing materials to design innovative new products and technologies—all based upon the chemical and physical properties of given substances. In this activity, students act as materials engineers as they learn about and use chemical and physical properties including tessellated geometric designs and shape to build better smartphone cases. Guided by the steps of the engineering design process, they analyze various materials and substances for their properties, design/test/improve a prototype model, and create a dot plot of their prototype testing results.
Rational Numbers Type of Unit: Concept Prior Knowledge Students should be able …
Rational Numbers
Type of Unit: Concept
Prior Knowledge
Students should be able to:
Solve problems with positive rational numbers. Plot positive rational numbers on a number line. Understand the equal sign. Use the greater than and less than symbols with positive numbers (not variables) and understand their relative positions on a number line. Recognize the first quadrant of the coordinate plane.
Lesson Flow
The first part of this unit builds on the prerequisite skills needed to develop the concept of negative numbers, the opposites of numbers, and absolute value. The unit starts with a real-world application that uses negative numbers so that students understand the need for them. The unit then introduces the idea of the opposite of a number and its absolute value and compares the difference in the definitions. The number line and positions of numbers on the number line is at the heart of the unit, including comparing positions with less than or greater than symbols.
The second part of the unit deals with the coordinate plane and extends student knowledge to all four quadrants. Students graph geometric figures on the coordinate plane and do initial calculations of distances that are a straight line. Students conclude the unit by investigating the reflections of figures across the x- and y-axes on the coordinate plane.
Proportional Relationships Type of Unit: Concept Prior Knowledge Students should be able …
Proportional Relationships
Type of Unit: Concept
Prior Knowledge
Students should be able to:
Understand what a rate and ratio are. Make a ratio table. Make a graph using values from a ratio table.
Lesson Flow
Students start the unit by predicting what will happen in certain situations. They intuitively discover they can predict the situations that are proportional and might have a hard time predicting the ones that are not. In Lessons 2–4, students use the same three situations to explore proportional relationships. Two of the relationships are proportional and one is not. They look at these situations in tables, equations, and graphs. After Lesson 4, students realize a proportional relationship is represented on a graph as a straight line that passes through the origin. In Lesson 5, they look at straight lines that do not represent a proportional relationship. Lesson 6 focuses on the idea of how a proportion that they solved in sixth grade relates to a proportional relationship. They follow that by looking at rates expressed as fractions, finding the unit rate (the constant of proportionality), and then using the constant of proportionality to solve a problem. In Lesson 8, students fine-tune their definition of proportional relationship by looking at situations and determining if they represent proportional relationships and justifying their reasoning. They then apply what they have learned to a situation about flags and stars and extend that thinking to comparing two prices—examining the equations and the graphs. The Putting It Together lesson has them solve two problems and then critique other student work.
Gallery 1 provides students with additional proportional relationship problems.
The second part of the unit works with percents. First, percents are tied to proportional relationships, and then students examine percent situations as formulas, graphs, and tables. They then move to a new context—salary increase—and see the similarities with sales taxes. Next, students explore percent decrease, and then they analyze inaccurate statements involving percents, explaining why the statements are incorrect. Students end this sequence of lessons with a formative assessment that focuses on percent increase and percent decrease and ties it to decimals.
Students have ample opportunities to check, deepen, and apply their understanding of proportional relationships, including percents, with the selection of problems in Gallery 2.
Students are asked whether they can determine the number of books in …
Students are asked whether they can determine the number of books in a stack by measuring the height of the stack, or the number of marbles in a collection of marbles by weighing the collection.Students are asked to identify for which situations they can determine the number of books in a stack of books by measuring the height of the stack or the number of marbles in a collection of marbles by weighing the collection.Key ConceptsAs students examine different numerical relationships, they come to understand that they can find the number of books or the number of marbles in situations in which the books are all the same thickness and the marbles are all the same weight. This “constant” is equal to the value BA for a ratio A : B; students begin to develop an intuitive understanding of proportional relationships.Goals and Learning ObjectivesExplore numerical relationshipsSWD: Some students with disabilities will benefit from a preview of the goals in each lesson. Have students highlight the critical features or concepts to help them pay close attention to salient information.
This is a "three star" geometry problem where prior math problem skills …
This is a "three star" geometry problem where prior math problem skills and proof experience is recommended to solve this relationship between the inverses of heights.
Working individually or in pairs, students compete to design, create, test and …
Working individually or in pairs, students compete to design, create, test and redesign free-standing, weight-bearing towers using Kapla(TM) wooden blocks. The challenge is to build the tallest tower while meeting the design criteria and minimizing the amount of material used all within a time limit. Students experiment with different geometric shapes used in structural designs and determine how design choices affect the height and strength of structures, becoming comfortable with the concepts of structural members and modeling.
Students build scale models of objects of their choice. In class they …
Students build scale models of objects of their choice. In class they measure the original object and pick a scale, deciding either to scale it up or scale it down. Then they create the models at home. Students give two presentations along the way, one after their calculations are done, and another after the models are completed. They learn how engineers use scale models in their designs of structures, products and systems. Two student worksheets as well as rubrics for project and presentation expectations and grading are provided.
Students explore the volume of three-dimensional shapes, connecting it to the operations …
Students explore the volume of three-dimensional shapes, connecting it to the operations of multiplication and addition, as well as classify two-dimensional shapes hierarchically.
No restrictions on your remixing, redistributing, or making derivative works. Give credit to the author, as required.
Your remixing, redistributing, or making derivatives works comes with some restrictions, including how it is shared.
Your redistributing comes with some restrictions. Do not remix or make derivative works.
Most restrictive license type. Prohibits most uses, sharing, and any changes.
Copyrighted materials, available under Fair Use and the TEACH Act for US-based educators, or other custom arrangements. Go to the resource provider to see their individual restrictions.