An Introduction To Mean Absolute Deviation (MAD)

Overview
Students calculate the mean absolute deviation (MAD) for three data sets and use it to decide which data set is best represented by the mean.
The concept of mean absolute deviation (MAD) is introduced. Students understand that the sum of the deviation of the data from the mean is zero. Students calculate the MAD and understand its significance. Students find the mean and MAD of a sample set of data.
Key Concepts
The mean absolute deviation (MAD) is a measure of how much the values in a data set deviate from the mean. It is calculated by finding the distance of each value from the mean and then finding the mean of these distances.
Goals and Learning Objectives
- Gain a deeper understanding of mean.
- Understand that the mean absolute deviation (MAD) is a measure of how well the mean represents the data.
- Compare data sets using measures of center (mode, median, mean) and spread (range and MAD).
- Show that the sum of deviations from the mean is zero.
Which Class Did Best on the Quiz?
Lesson Guide
Have students work in pairs to determine the middle 50 percent of the values for each line plot. Have them use this information to discuss which class did best on the quiz.
Mathematics
The middle 50% of the data:
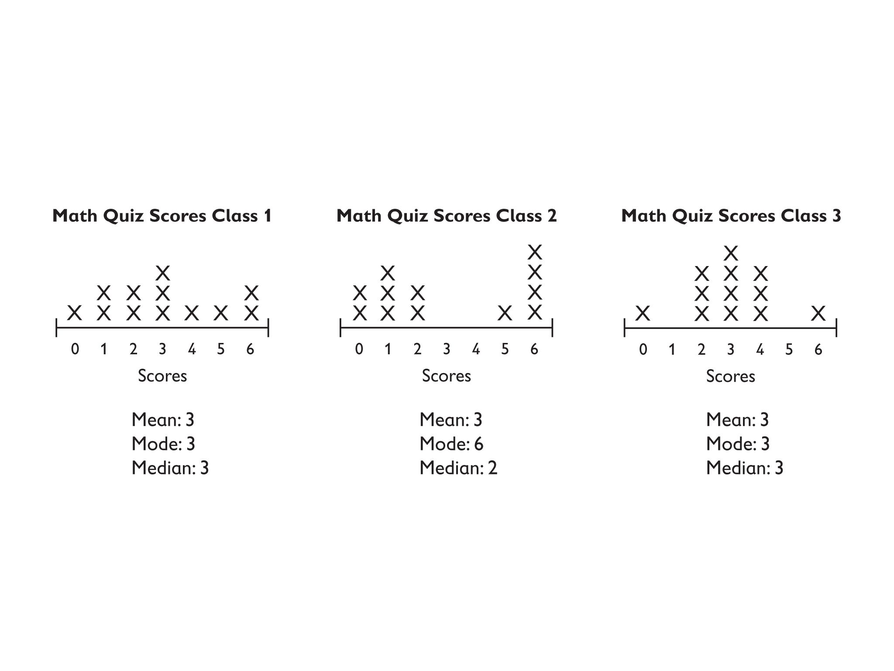
Discuss which class students think did best and why. Did they all score about the same since the mean is 3 for each? Students should notice that even though the mean is 3, no one in Class 2 had a score of 3. Students should also notice that the data for Class 3 is the most tightly clustered around 3, indicating that they truly scored around 3.
Although we could say that each class scored “around 3,” clearly they didn't have the same results (which is one reason we need the line plot, which shows the shape of the data and not just the measures of center). Students should use terms such as “spread out” or “clustered” to describe the shape of the data.
SWD: Promote a language-rich environment in which students are encouraged to work together and learn from one another. Make sure to model appropriate mathematical language for students, especially with the use of new terms. Post the terms spread out and clustered with definitions, and remind students to use these terms when describing data.
Opening
Which Class Did Best on the Quiz?
Look at the three line plots.
- Working with a partner, mark the middle 50 percent of the values on each line plot.
- Then turn to your partner and discuss the question: Which class do you think did best on the quiz?

Math Mission
Lesson Guide
Discuss the Math Mission. Students will use the mean absolute deviation to decide whether the mean of a set of data is a good representation of the data.
Opening
Use the mean absolute deviation (MAD) to decide whether the mean of a set of data is a good representation of the data.
Which Class?
Lesson Guide
Students are introduced to the mean absolute deviation (MAD).
Interventions
Student has trouble relating the MADs to the data sets.
- Look at each line plot. Think about how the values are spread out around the mean, which is 3.
- In Class 2, how do the values in the plot compare to the mean? Are most of them close to the mean or are they spread out?
- In Class 2, are there any values that are actually equal to the mean?
- In Class 3, how do the data values in the plot compare to the mean? Are most of them close to the mean or are they spread out?
- The MAD for Class 1 is between the MADs for the other two classes. Why does this make sense, based on the shape of the graph?
Possible Answers
- Answers will vary. Sample answer: Class 2 will have the highest MAD because the data is spread out away from the mean.
- Answers will vary. Sample answer: Class 3 will have the lowest MAD because a large percent of the data is near the mean.
- Explanations will vary.
Work Time
Which Class?
To better understand whether the mean is a good representation of a data set, you can calculate a measure called the mean absolute deviation (MAD).
The MAD is a measure of how spread out the values in a data set are from the mean. The greater the MAD is, the farther away the data are, on average, from the mean.
- Which class do you think will have the highest MAD?
- Which class do you think will have the lowest MAD?
- Explain your answers.

Hint:
- Will most of the data with a low MAD be close to the mean or far away?
- Will most of the data with a high MAD be close to the mean or far away?
Calculate the Mean Absolute Deviation
Lesson Guide
Students who do not carefully organize their work are likely to make errors in computing the MAD. Encourage students to write the data values in a column and the distances of the values from the mean in a separate column next to the data values.
SWD: Remind students who are allowed the option of a five-function calculator that they may use one for this task.
ELL: If students are struggling, present the guiding questions from the Interventions section, and be sure that ELLs can follow what you are saying. Provide written questions and use a pace that is appropriate for non-English speakers.
Model the activity step-by-step. This modeling will ensure that ELL students understand the task and therefore focus on the mathematics of the activity rather than on trying to figure out the directions.
Interventions
Student has difficulty organizing their work.
- Try organizing your work as I did.
- List the 12 scores down the first column.
- In the next column, list the distance between each score and the mean.
- Now you need to find the mean of the differences in the second column. How can you do this?
Answers
The MAD is a measure of spread. It helps show how far the data are spread by measuring the mean deviation from the mean. The calculation for the Class 1 line plot would look like this:
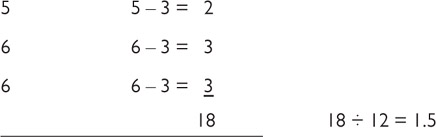
Notice that the smaller number is subtracted from the larger number. This is because we are looking for the distance between the numbers, which must be positive. The sum of the differences is 18, and there are 12 numbers; 18 ÷ 12 = 1.5. The MAD is 1.5. This means that the data deviate from the mean by an average of 1.5.
Here are the calculations for Class 2 and Class 3.
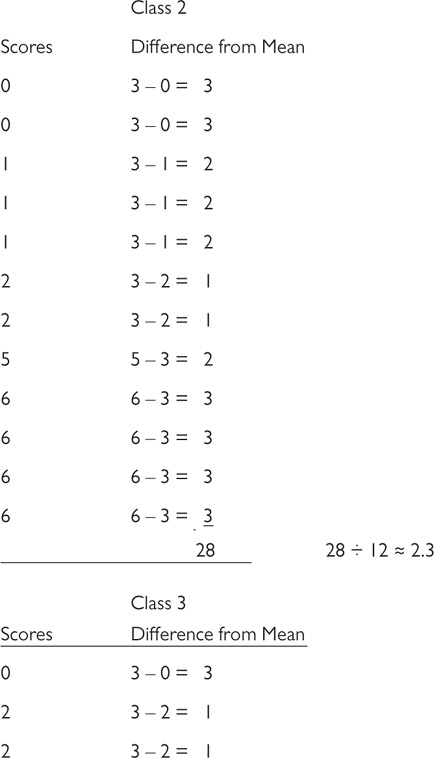
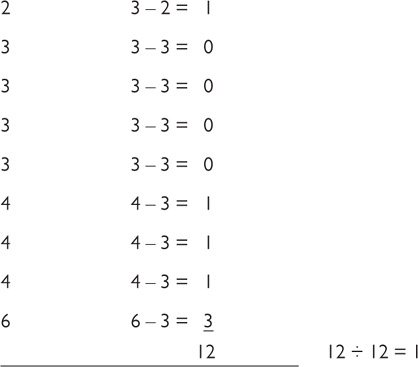
Class 2 has the highest MAD. Class 3 has the lowest. Possible explanation: For Class 2, the values are spread out on either side of the mean, and no value is actually equal to the mean. In Class 3, most data values are clustered around the mean (10 of the 12 values are between 2 and 4).
Work Time
Calculate the Mean Absolute Deviation
Follow these steps to find the MAD for each class’s line plot:
- List the data for the class vertically.
- Next to each score, write the distance of that score from the mean.
- Find the mean of these distances by adding them together and dividing by the number of values.
Hint:
Remember that distances are always positive numbers.
Compare Your Prediction
Lesson Guide
Students will compare their predictions of which line plots have the highest and lowest MADs with the actual calculations.
Answers
- Answers will vary.
Work Time
Compare Your Prediction
- Compare your prediction of which line plots would have the highest and lowest MAD values with your actual calculations.

Prepare a Presentation
Lesson Guide
Students will prepare a presentation to share with their classmates.
Preparing for Ways of Thinking
Look for students who understand that the mean absolute deviation (MAD) is a measure of how spread out the values in a data set are from the mean.
Look for students who make the connection between the mean absolute deviation and the mean, and those that understand that the mean absolute deviation can help determine if the mean is a good indicator of how the data looks. Make note of students who are having trouble understanding how to use the MAD to compare the class data, so you can address any misconceptions during the Ways of Thinking discussion.
Challenge Problem
Answers
- There would be a value at 0 and a value at 6, but all the rest of the values would be 3.
- The sum of the absolute deviations would be 3 + 3 + 10(0) = 6, and so the MAD would be 6 ÷ 12, or 0.5.
Work Time
Prepare a Presentation
Prepare a presentation that explains how to use a mean absolute deviation to analyze a set of data.
Challenge Problem
- What would the line plot look like for a similar class quiz data set (12 scores with a range of 6, from 0 to 6), but with the smallest possible MAD?
- What would the MAD be?
Make Connections
Lesson Guide
After the presentations, remind students that they have until Lesson 13 to collect the data for their project. Give students a deadline for data collection so that they can plan ahead to meet the deadline.
Mathematics
Discuss the results. Have students share their reasoning why Class 2 has the highest MAD and Class 3 the lowest. Make sure students understand that the smaller the MAD, the less the data deviates from the mean and the better the mean is as a descriptor of the data.
Show students that the sum of the distances from the mean for the values above the mean is the same as the sum of the distances from the mean for the values below the mean. This is because the mean is the balance point of the data. This is also a way to check that the mean is correct.
Have students consider these questions:
- Did you expect that Class 2 would have the highest MAD and Class 3 would have the lowest?
- Which set of data is best represented by a mean of 3? Or, which class has a typical score of 3? (Answer: Class 3 has the smallest MAD, so it is best represented by the mean.)
- Since each class had a mean of 3, how can we decide which class did best on the test? (Possible answer: Class 3 has the most scores closest to 3; therefore, it had the fewest low scores and did the best on the test.)
ELL: Encourage students to use the academic vocabulary they are learning. When ELLs participate in the discussion, monitor for knowledge of the topic. Follow up on statements that seem unclear. When ELLs contribute, focus on content and don't allow grammar difficulties to distract you from understanding the meaning (as much as possible). Help ELLs who make grammar mistakes by rephrasing, ensure your rephrasing does not interrupt or interfere with their thinking.
Provide sentence frames such as the following:
“I learned that mean absolute deviation is different then mean because _______.”
Mathematical Practices
Mathematical Practice 1: Make sense of problems and persevere in solving them.
- Choose presenters so that students can see a variety of problem-solving methods.
Mathematical Practice 3: Construct viable arguments and critique the reasoning of others.
- As students present, encourage other students to ask questions and critique each presenter's reasoning.
Mathematical Practice 6: Attend to precision.
- Encourage precision in language so that the class can develop a clear understanding of mean absolute deviation.
Performance Task
Ways of Thinking: Make Connections
Take notes about students’ reasoning about the MAD values they found.
Hint:
As your classmates present, ask questions such as:
- How did you find the MAD for each set of data?
- What does the MAD tell you about each set of data?
- How did your MAD compare with your prediction?
Mean Absolute Deviation
Lesson Guide
The students write a summary of what they learned about the mean absolute deviation (MAD).
A Possible Summary
The mean absolute deviation (MAD) is a measure of how spread out the data values are from the mean. It is calculated by finding the distance of each data value from the mean and then calculating the mean of those distances. The MAD is a measure of spread, like the range, because it gives us an idea of how much the data are spread out. If the data are tightly clustered around the mean, the MAD is low. If the data are spread out from the mean, the MAD is high.
Formative Assessment
Summary of the Math: Mean Absolute Deviation
Write a summary of what you learned about the mean absolute deviation.
Hint:
Check your summary.
- Do you describe what the mean absolute deviation tells us about a set of data?
- Do you explain how to calculate the MAD?
Reflect on Your Work
Lesson Guide
Have each student write a brief reflection before the end of class. Review the reflections to find out how students think the MAD is related to the mean.
Work Time
Reflection
Write a reflection about the ideas discussed in class today. Use this sentence starter if you find it to be helpful.
I think the MAD is related to the mean because …