This is a task from the Illustrative Mathematics website that is one …
This is a task from the Illustrative Mathematics website that is one part of a complete illustration of the standard to which it is aligned. Each task has at least one solution and some commentary that addresses important asects of the task and its potential use. Here are the first few lines of the commentary for this task: When Marcus started high school, his grandmother opened a college savings account. On the first day of each school year she deposited money into the ac...
CK-12 Foundation's Basic Algebra FlexBook is an introduction to the algebraic topics …
CK-12 Foundation's Basic Algebra FlexBook is an introduction to the algebraic topics of functions, equations, and graphs for middle-school and high-school students.
Module 2 builds on students' previous work with units and with functions …
Module 2 builds on students' previous work with units and with functions from Algebra I, and with trigonometric ratios and circles from high school Geometry. The heart of the module is the study of precise definitions of sine and cosine (as well as tangent and the co-functions) using transformational geometry from high school Geometry. This precision leads to a discussion of a mathematically natural unit of rotational measure, a radian, and students begin to build fluency with the values of the trigonometric functions in terms of radians. Students graph sinusoidal and other trigonometric functions, and use the graphs to help in modeling and discovering properties of trigonometric functions. The study of the properties culminates in the proof of the Pythagorean identity and other trigonometric identities.
Find the rest of the EngageNY Mathematics resources at https://archive.org/details/engageny-mathematics.
"In this module, students synthesize and generalize what they have learned about …
"In this module, students synthesize and generalize what they have learned about a variety of function families. They extend the domain of exponential functions to the entire real line (N-RN.A.1) and then extend their work with these functions to include solving exponential equations with logarithms (F-LE.A.4). They explore (with appropriate tools) the effects of transformations on graphs of exponential and logarithmic functions. They notice that the transformations on a graph of a logarithmic function relate to the logarithmic properties (F-BF.B.3). Students identify appropriate types of functions to model a situation. They adjust parameters to improve the model, and they compare models by analyzing appropriateness of fit and making judgments about the domain over which a model is a good fit. The description of modeling as, the process of choosing and using mathematics and statistics to analyze empirical situations, to understand them better, and to make decisions, is at the heart of this module. In particular, through repeated opportunities in working through the modeling cycle (see page 61 of the CCLS), students acquire the insight that the same mathematical or statistical structure can sometimes model seemingly different situations.
Find the rest of the EngageNY Mathematics resources at https://archive.org/details/engageny-mathematics."
In this module, students reconnect with and deepen their understanding of statistics …
In this module, students reconnect with and deepen their understanding of statistics and probability concepts first introduced in Grades 6, 7, and 8. Students develop a set of tools for understanding and interpreting variability in data, and begin to make more informed decisions from data. They work with data distributions of various shapes, centers, and spreads. Students build on their experience with bivariate quantitative data from Grade 8. This module sets the stage for more extensive work with sampling and inference in later grades.
Find the rest of the EngageNY Mathematics resources at https://archive.org/details/engageny-mathematics.
In earlier modules, students analyze the process of solving equations and developing …
In earlier modules, students analyze the process of solving equations and developing fluency in writing, interpreting, and translating between various forms of linear equations (Module 1) and linear and exponential functions (Module 3). These experiences combined with modeling with data (Module 2), set the stage for Module 4. Here students continue to interpret expressions, create equations, rewrite equations and functions in different but equivalent forms, and graph and interpret functions, but this time using polynomial functions, and more specifically quadratic functions, as well as square root and cube root functions.
Find the rest of the EngageNY Mathematics resources at https://archive.org/details/engageny-mathematics.
In this lesson, students will explore numbers and their relationships through rhythm …
In this lesson, students will explore numbers and their relationships through rhythm and learn how every aspect of music can be described mathematically. Includes a probability challenge for students.
Students design and develop a useful assistive device for people challenged by …
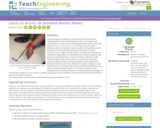
Students design and develop a useful assistive device for people challenged by fine motor skill development who cannot grasp and control objects. In the process of designing prototype devices, they learn about the engineering design process and how to use it to solve problems. After an introduction about the effects of disabilities and the importance of hand and finger dexterity, student pairs research, brainstorm, plan, budget, compare, select, prototype, test, evaluate and modify their design ideas to create devices that enable a student to hold and use a small paintbrush or crayon. The design challenge includes clearly identified criteria and constraints, to which teams rate their competing design solutions. Prototype testing includes independent evaluations by three classmates, after which students redesign to make improvements. To conclude, teams make one-slide presentations to the class to recap their design projects. This activity incorporates a 3D modeling and 3D printing component as students generate prototypes of their designs. However, if no 3D printer is available, the project can be modified to use traditional and/or simpler fabrication processes and basic materials.
Includes chapters on: Basics of Geometry, Reasoning and Proof, Parallel and Perpendicular …
Includes chapters on: Basics of Geometry, Reasoning and Proof, Parallel and Perpendicular Lines, Triangles and Congruence, Relationships with Triangles, Polygons and Quadrilaterals, Similarity, Right Triangle Trigonometry, Circles, Perimeter and Area, Surface Area and Volume, Rigid Transformations.
CK-12 Foundation's Geometry FlexBook is a clear presentation of the essentials of …
CK-12 Foundation's Geometry FlexBook is a clear presentation of the essentials of geometry for the high school student. Topics include: Proof, Congruent Triangles, Quadrilaterals, Similarity, Perimeter & Area, Volume, and Transformations.
Students are challenged to design a way to drop a raw egg …
Students are challenged to design a way to drop a raw egg from varying heights without letting the egg break. Creative thinking and evaluation of results are critical to the project.
Students explore the definition of a function by playing an interactive game …
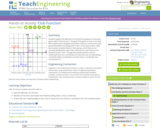
Students explore the definition of a function by playing an interactive game called "Club Function." The goal of the game is to be in the club! With students each assigned to be either a zebra or a rhinoceros, they group themselves according to the "rules" of the club function. After two minutes, students freeze in their groups, and if they are not correctly following the rules of the club function, then they are not allowed into the "club." Through this activity students come to understand that one x-coordinate can only have one corresponding y-coordinate while y-coordinates can have many x-coordinates that correspond to it.
This tutorial explains exponential functions and provides links pertaining to topics on …
This tutorial explains exponential functions and provides links pertaining to topics on them. You will learn to use the exponent keys on your calculator, to graph exponential functions, and to solve compound interest problems.
No restrictions on your remixing, redistributing, or making derivative works. Give credit to the author, as required.
Your remixing, redistributing, or making derivatives works comes with some restrictions, including how it is shared.
Your redistributing comes with some restrictions. Do not remix or make derivative works.
Most restrictive license type. Prohibits most uses, sharing, and any changes.
Copyrighted materials, available under Fair Use and the TEACH Act for US-based educators, or other custom arrangements. Go to the resource provider to see their individual restrictions.