This 10-day module builds on Grade 2 concepts about data, graphing, and …
This 10-day module builds on Grade 2 concepts about data, graphing, and line plots. The two topics in this module focus on generating and analyzing categorical and measurement data. By the end of the module, students are working with a mixture of scaled picture graphs, bar graphs, and line plots to problem solve using both categorical and measurement data.
Find the rest of the EngageNY Mathematics resources at https://archive.org/details/engageny-mathematics.
Explains how to make a line or dot plot and record the …
Explains how to make a line or dot plot and record the data on it. [5:05]
Khan Academy learning modules include a Community space where users can ask questions and seek help from community members. Educators should consult with their Technology administrators to determine the use of Khan Academy learning modules in their classroom. Please review materials from external sites before sharing with students.
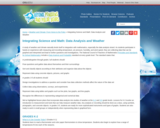
Become a “farmer” on a journey from pre-planting to harvest to see …
Become a “farmer” on a journey from pre-planting to harvest to see what decisions farmers are making every year as they farm. Growers across the country are gaining access to more and more data about their farms. The data is being gathered through equipment or other precision agriculture techniques, then it must be analyzed so that decisions made will be based on evidence. Scientists in all disciplines use the same practices as farmers. This unit features 5 lessons and 27 files. Lessons are aligned to NGSS.
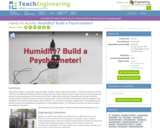
Using thermometers, cotton balls, string and water, students make simple psychrometers—a tool …
Using thermometers, cotton balls, string and water, students make simple psychrometers—a tool that measures humidity. They learn the difference between relative humidity (the ratio of water vapor content to water vapor carrying capacity) and dew point (the temperature at which dew forms). Teams collect data using their homemade psychrometers and then calculate relative humidity inside and outside, comparing their results to an off-the-shelf psychrometer (if available). A lab worksheet is provided for data collection and calculation. As a real-world connection, students learn that humidity and air density is taken into consideration by engineers for many design projects. To conclude, they answer and discuss analysis and application questions.
A series of pages that help us understand testing one or more …
A series of pages that help us understand testing one or more components of a trend using specific comparisons, a set of coefficients, error analysis of variance and the probability value.
This article discusses how the study of weather can meet the NCTM …
This article discusses how the study of weather can meet the NCTM Data Analysis and Probability standard. Links to lessons for grades K-2 and 3-5 are provided.
Invitations to Inquiry are short instructional activities designed to help middle and …
Invitations to Inquiry are short instructional activities designed to help middle and high school students work with large data sets. Teachers and students use the interactive FieldScope platform to collect, visualize, and analyze environmental data. With these new Inquiries, students can explore FieldScope's advanced mapping and graphing tools to dig deeper into data in the context of meaningful science classroom lessons.
In this video segment adapted from NOVA, scientist Mike Garcia draws lava …
In this video segment adapted from NOVA, scientist Mike Garcia draws lava samples at the foot of the active Kilauea volcano to see if it is related to its neighboring volcano, Mauna Loa.
Data from the 1880 and the 1900 Censuses, and how these relate …
Data from the 1880 and the 1900 Censuses, and how these relate to the lives of Almanzo and Laura Ingalls Wilder, are presented here. There are also ideas for teaching using primary sources.
The Locating Luna virtual reality experience was specifically designed to assist in …
The Locating Luna virtual reality experience was specifically designed to assist in teaching Data Visualization concepts from the Computer Science Teachers’ Association K-12 Computer Science Standards. The player is in a dark swampy forest and must find their dog. The player can light standing torches to mark their path and climb a tower lookout to get a bird’s eye view. Using the built-in microphone on the Oculus Go, the player can also call out to their dog and, if close by, they will hear a barking response in the direction of their dog. During the game, all player actions are recorded in an action log, which the user can download from the headset and analyze outside the game.
This video provides an opportunity to create a Box and Whisker Plot. …
This video provides an opportunity to create a Box and Whisker Plot. A pdf worksheet is available by clicking on the hyperlink at the bottom of the page. As you watch and listen to the teacher and student interact it helps clarify the thinking behind applying this concept. [6:13]
Distributions and Variability Type of Unit: Project Prior Knowledge Students should be …
Distributions and Variability
Type of Unit: Project
Prior Knowledge
Students should be able to:
Represent and interpret data using a line plot. Understand other visual representations of data.
Lesson Flow
Students begin the unit by discussing what constitutes a statistical question. In order to answer statistical questions, data must be gathered in a consistent and accurate manner and then analyzed using appropriate tools.
Students learn different tools for analyzing data, including:
Measures of center: mean (average), median, mode Measures of spread: mean absolute deviation, lower and upper extremes, lower and upper quartile, interquartile range Visual representations: line plot, box plot, histogram
These tools are compared and contrasted to better understand the benefits and limitations of each. Analyzing different data sets using these tools will develop an understanding for which ones are the most appropriate to interpret the given data.
To demonstrate their understanding of the concepts, students will work on a project for the duration of the unit. The project will involve identifying an appropriate statistical question, collecting data, analyzing data, and presenting the results. It will serve as the final assessment.
Students use the Box Plot interactive, which allows them to create line …
Students use the Box Plot interactive, which allows them to create line plots and see the corresponding box plots. They use this tool to create data sets with box plots that satisfy given criteria.Students investigate how the box plot changes as the data points in the line plot are moved. Students can manipulate data points to change aspects of the box plot and to see how the line plot changes. Students create box plots that fit certain criteria.Key ConceptsThis lesson focuses on the connection between a data set and its box plot. It reinforces the idea that a box plot shows the spread of a data set, but not the individual data points.Students will observe the following similarities and differences between line plots and box plots:Line plots allow us to see and count individual values, while box plots do not.Line plots allow us to find the mean and the mode of a set of data, while box plots do not.Box plots are useful for very large data sets, while line plots are not.Box plots give us a better picture of how the values in a data set are distributed than line plots do, and they allow us to see measures of spread easily.Goals and Learning ObjectivesExperiment with different line plots to see the effect on the corresponding box plots.Create data sets with box plots that satisfy different criteria.Compare and contrast line plots and box plots.
No restrictions on your remixing, redistributing, or making derivative works. Give credit to the author, as required.
Your remixing, redistributing, or making derivatives works comes with some restrictions, including how it is shared.
Your redistributing comes with some restrictions. Do not remix or make derivative works.
Most restrictive license type. Prohibits most uses, sharing, and any changes.
Copyrighted materials, available under Fair Use and the TEACH Act for US-based educators, or other custom arrangements. Go to the resource provider to see their individual restrictions.