
A set of resource cards describing local flora and fauna
- Subject:
- Biology
- Science
- Material Type:
- Data Set
- Reading
- Provider:
- Pacific Northwest National Laborartory
- Author:
- Pacific Northwest National Laborartory
- Date Added:
- 11/08/2024

A set of resource cards describing local flora and fauna

This interactive activity produced for Teachers' Domain shows the relationship between tectonic boundaries and the locations of earthquake events and volcanoes around the world.
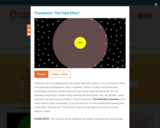
Transistors are the building blocks of modern electronic devices. Your cell phones, iPods, and computers all depend on them to operate. Thanks to today's microfabrication technology, transistors can be made very tiny and be massively produced. You are probably using billions of them while working with this activity now--as of 2006, a dual-core Intel microprocessor contains 1.7 billion transistors. The field effect transistor is the most common type of transistor. So we will focus on it in this activity.
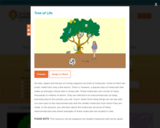
All cells, organs and tissues of a living organism are built of molecules. Some of them are small, made from only a few atoms. There is, however, a special class of molecules that make up and play critical roles in living cells. These molecules can consist of many thousands to millions of atoms. They are referred to as macromolecules (or large biomolecules).

Census Bureau statistics show the variety in living arrangements that exist in the United States. Find historical information as well as current figures.

The U.S. Census Bureau has given detailed information on Health Insurance. Each category is provided via a link. Definitions are included within these categories.

This U.S. Census website gives current and past information on the income of Americans.

This site is great for gathering sociological data. Data can be related to a wide variety of topics. Great for research!

This U.S. Census Bureau Web site has two population clocks with notes available. One clock shows the population increase for the United States. The other shows the world population increase.

Series of projections for different years.

Visual representations of population distribution by age and sex for any country.
This activity is for an introductory oceanography course. It is designed to allow students to use various tools (satellite images, Google Earth) to explore the shape of the sea floor and ocean basins in order to gain a better understanding of both the processes that form ocean basins, as well as how the shape of ocean basins influences physical and biological processes.
Students will utilize an applet to further expand their knowledge of confidence intervals.
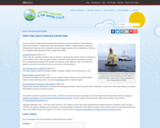
Video clips from federal and regional agencies show scientists at work with tools used to collect data about the climate and weather. This article, from the free, online magazine Beyond Weather and the Water Cycle, will help students visualize the tools and how they are used in the atmosphere, at sea, and other hard-to-access locations.
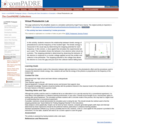
This is a virtual lab activity on the photoelectric effect based on a Java applet simulation of the experiment.
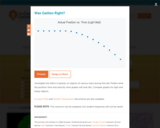
Investigate the effect of gravity on objects of various mass during free fall. Predict what the position-time and velocity-time graphs will look like. Compare graphs for light and heavy objects. Was Galileo Right is the last of five SmartGraphs activities designed for a typical physical science unit of study on the motion of objects.
Writing a Wikipedia article about a genetic disease is a good culminating activity for a genetics course or module, as it requires synthesizing and interpreting a wide range of genetic information. This assignment also includes a potential service component, which is normally very difficult in genetics.