This video talka about what is easily one of the most fundamental …
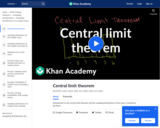
This video talka about what is easily one of the most fundamental and profound concepts in statistics and maybe in all of mathematics. And that's the central limit theorem.
Khan Academy learning modules include a Community space where users can ask questions and seek help from community members. Educators should consult with their Technology administrators to determine the use of Khan Academy learning modules in their classroom. Please review materials from external sites before sharing with students.
What rights to fair use do you have as a creator? Kids …
What rights to fair use do you have as a creator? Kids can be voracious consumers -- and creators -- of media, and it's easier than ever for them to find and share digital content online. But do middle schoolers know about concepts like fair use, copyright, and public domain? Give students a framework they can use to better understand how fair use works in the real world. Approximately 50 mins.
LESSON OBJECTIVES: Define the terms "copyright," "public domain," and "fair use." Identify the purpose of the Four Factors of Fair Use. Apply fair use to real-world examples, making a case for or against.
In this video segment adapted from NOVA, scientist Mike Garcia draws lava …
In this video segment adapted from NOVA, scientist Mike Garcia draws lava samples at the foot of the active Kilauea volcano to see if it is related to its neighboring volcano, Mauna Loa.
This QuickTime movie discusses sampling of a population using M&M's candy. As …
This QuickTime movie discusses sampling of a population using M&M's candy. As you watch and listen to the teacher and student interact it helps clarify the thinking behind applying this concept.
Samples and ProbabilityType of Unit: ConceptualPrior KnowledgeStudents should be able to:Understand the …
Samples and ProbabilityType of Unit: ConceptualPrior KnowledgeStudents should be able to:Understand the concept of a ratio.Write ratios as percents.Describe data using measures of center.Display and interpret data in dot plots, histograms, and box plots.Lesson FlowStudents begin to think about probability by considering the relative likelihood of familiar events on the continuum between impossible and certain. Students begin to formalize this understanding of probability. They are introduced to the concept of probability as a measure of likelihood, and how to calculate probability of equally likely events using a ratio. The terms (impossible, certain, etc.) are given numerical values. Next, students compare expected results to actual results by calculating the probability of an event and conducting an experiment. Students explore the probability of outcomes that are not equally likely. They collect data to estimate the experimental probabilities. They use ratio and proportion to predict results for a large number of trials. Students learn about compound events. They use tree diagrams, tables, and systematic lists as tools to find the sample space. They determine the theoretical probability of first independent, and then dependent events. In Lesson 10 students identify a question to investigate for a unit project and submit a proposal. They then complete a Self Check. In Lesson 11, students review the results of the Self Check, solve a related problem, and take a Quiz.Students are introduced to the concept of sampling as a method of determining characteristics of a population. They consider how a sample can be random or biased, and think about methods for randomly sampling a population to ensure that it is representative. In Lesson 13, students collect and analyze data for their unit project. Students begin to apply their knowledge of statistics learned in sixth grade. They determine the typical class score from a sample of the population, and reason about the representativeness of the sample. Then, students begin to develop intuition about appropriate sample size by conducting an experiment. They compare different sample sizes, and decide whether increasing the sample size improves the results. In Lesson 16 and Lesson 17, students compare two data sets using any tools they wish. Students will be reminded of Mean Average Deviation (MAD), which will be a useful tool in this situation. Students complete another Self Check, review the results of their Self Check, and solve additional problems. The unit ends with three days for students to work on Gallery problems, possibly using one of the days to complete their project or get help on their project if needed, two days for students to present their unit projects to the class, and one day for the End of Unit Assessment.
Students will apply their knowledge of statistics learned in sixth grade. They …
Students will apply their knowledge of statistics learned in sixth grade. They will determine the typical class score from a sample of the population, and reason about the representativeness of the sample.Students analyze test score data from a fictitious seventh grade class and make generalizations about district-wide results. They then compare the data to a second seventh grade class and reason about whether these are random samples. Students will review measures of center and spread as they find evidence to draw conclusions about the data.Key ConceptsSample size will be considered as it affects the conclusions of an analysis of a population.Students will review tools that they used in sixth grade to analyze data, such as measures of center and spread, and different types of graphs.Goals and Learning ObjectivesExplore sample size.Look at the effects of using a nonrandom sample.Review tools used to analyze data.
Students begin to develop intuition about appropriate sample size by conducting an …
Students begin to develop intuition about appropriate sample size by conducting an experiment. They compare different sample sizes and whether increasing the sample size improves the results.Key ConceptsSampling is a way to discover unknown characteristics about a population. The size of the sample is important in determining the accuracy of the results. Ratio and proportion are used to compare the sample to the population.Goals and Learning ObjectivesStudents will use sampling to determine the number of different color marbles in a jar.Students will explore sample size compared to population size.
Students are introduced to the concept of sampling as a method of …
Students are introduced to the concept of sampling as a method of determining characteristics of a population. They consider how a sample can be random or biased, and think of methods for randomly sampling a population to ensure that it is representative.The idea of sampling is connected to probability; a relatively small set of data (a random sample/number of trials) can be used to generalize about a population (or determine probability). A larger sample (more trials) will give more confidence in the conclusions, but how large of a sample is needed?Students also discuss what random means and how to generate a random sample. Random samples are compared to biased samples and give insight into how statistics can be misleading (intentionally or otherwise).Key ConceptsRandom samples are related to probability. In probability, the number of trials is a sample used to generalize about the probability of an event. The results in probability are random if we are looking at equally likely outcomes. If a data sample is not random, the conclusions about the population will not reflect it.Terminology introduced in this lesson:population: the entire set of objects that can be considered when asking a statistical questionsample: a subset of a population; can be random, where each object in the population is equally likely to be in the sample, or biased, where not every object in the population is equally likely to be in the sampleGoals and Learning ObjectivesIntroduce sampling as a method to generalize about a population.Discuss the concept of a random sample versus a biased sample.Determine methods to generate random samples.Understand that biased samples are sometimes used to mislead.SWD: Some students with disabilities will benefit from a preview of the goals in this lesson. Students can highlight the critical features and/or concepts and will help them to pay close attention to salient information.
Students critique and improve their work on the Self Check, then work …
Students critique and improve their work on the Self Check, then work on additional problems. Students revise the Self Check problem from the previous lesson and discuss their strategies.Key ConceptsStudents apply what they have learned to date to solve the problems in this lesson.Goals and Learning ObjectivesApply knowledge of sampling and data analysis to solve problems.Determine a random, representative sample that is nonbiased and of adequate sample size.Generalize about a population based on sampling.Compare data sets.
CK-12 Advanced Probability and Statistics introduces students to basic topics in statistics …
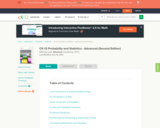
CK-12 Advanced Probability and Statistics introduces students to basic topics in statistics and probability but finishes with the rigorous topics an advanced placement course requires. Includes visualizations of data, introduction to probability, discrete probability distribution, normal distribution, planning and conducting a study, sampling distributions, hypothesis testing, regression and correlation, Chi-Square, analysis of variance, and non-parametric statistics.
CK-12 Advanced Probability and Statistics Teacher's Edition provides tips and enrichment activities …
CK-12 Advanced Probability and Statistics Teacher's Edition provides tips and enrichment activities for teaching CK-12 Advanced Probability and Statistics Student Edition. The solution and assessment guides are available upon request.
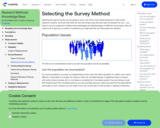
Details the following issues that should be considered when selecting the survey …
Details the following issues that should be considered when selecting the survey method: population, sampling, questionnaire, bias, and administration.
In this video, a simulation is used to demonstrate the sampling distribution …
In this video, a simulation is used to demonstrate the sampling distribution of sample proportions. [4:34]
Khan Academy learning modules include a Community space where users can ask questions and seek help from community members. Educators should consult with their Technology administrators to determine the use of Khan Academy learning modules in their classroom. Please review materials from external sites before sharing with students.
No restrictions on your remixing, redistributing, or making derivative works. Give credit to the author, as required.
Your remixing, redistributing, or making derivatives works comes with some restrictions, including how it is shared.
Your redistributing comes with some restrictions. Do not remix or make derivative works.
Most restrictive license type. Prohibits most uses, sharing, and any changes.
Copyrighted materials, available under Fair Use and the TEACH Act for US-based educators, or other custom arrangements. Go to the resource provider to see their individual restrictions.