Updating search results...

Search Resources

30 Results

View
Selected filters:
  • visualization
Concord Consortium: Intermolecular Attractions
Read the Fine Print
Rating
0.0 stars

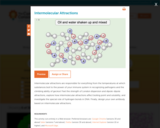
This concept-building module contains a variety of simulations for exploring factors that cause molecules to attract each other. It was developed to help secondary students understand both polar and non-polar covalent bonding. Users can manipulate models to see how the strength of attraction is affected by distance from one molecule to another, by heating the substance, and by mixing polar and non-polar substances. Part II of the activity is devoted to hydrogen bonds, and explores why water is one of the most important molecules for life's existence. This item is part of the Concord Consortium, a nonprofit research and development organization dedicated to transforming education through technology.

Subject:
Chemistry
Science
Material Type:
Lesson
Provider:
Concord Consortium
Provider Set:
Concord Consortium Collection
Author:
National Science Foundation
The Concord Consortium
Date Added:
08/22/2011
Create a Community My Map
Conditional Remix & Share Permitted
CC BY-SA
Rating
0.0 stars

Customize a map that highlights locations important to your community and culture with Google My Maps. Time to complete: 45-90 minutes

Subject:
Business and Communication
Communication
Social Studies
Technology
Material Type:
Lesson
Lesson Plan
Provider:
Google
Provider Set:
Applied Digital Skills
Date Added:
05/03/2022
Density Rainbow and the Great Viscosity Race
Read the Fine Print
Educational Use
Rating
0.0 stars

Students explore the densities and viscosities of fluids as they create a colorful 'rainbow' using household liquids. While letting the fluids in the rainbow settle, students conduct 'The Great Viscosity Race,' another short experiment that illustrates the difference between viscosity and density. Later, students record the density rainbow with sketches and/or photography.

Subject:
Practitioner Support
Material Type:
Activity/Lab
Provider:
TeachEngineering
Provider Set:
TeachEngineering
Author:
Cody Taylor
Denise Carlson
Gala Camacho
Jean Hertzberg
Malinda Schaefer Zarske
Date Added:
10/14/2015
Design an Infographic in Google Drawings
Conditional Remix & Share Permitted
CC BY-SA
Rating
0.0 stars

Summarize and communicate information visually by creating an infographic in Google Drawings. Time to complete: 45-90 minutes

Subject:
Arts
Business and Communication
Communication
Science
Social Studies
Technology
Material Type:
Lesson
Lesson Plan
Provider:
Google
Provider Set:
Applied Digital Skills
Date Added:
05/03/2022
Floating and Falling Flows
Read the Fine Print
Educational Use
Rating
0.0 stars

Students discover fluid dynamics related to buoyancy through experimentation and optional photography. Using one set of fluids, they make light fluids rise through denser fluids. Using another set, they make dense fluids sink through a lighter fluid. In both cases, they see and record beautiful fluid motion. Activities are also suitable as class demonstrations. The natural beauty of fluid flow opens the door to seeing the beauty of physics in general.

Subject:
Arts
Engineering
Physics
Science
Visual Arts
Material Type:
Activity/Lab
Provider:
TeachEngineering
Provider Set:
TeachEngineering
Author:
Cody Taylor
Denise Carlson
Gala Camacho
Jean Hertzberg
Malinda Schaefer Zarske
Date Added:
09/18/2014
Graphing and the Coordinate Plane
Read the Fine Print
Educational Use
Rating
0.0 stars

This lesson plan helps students understand how to graph ordered pairs on the coordinate plane. Lots of resources are available to teachers and students at this website.

Subject:
Mathematics
Material Type:
Lesson
Provider:
Shodor
Date Added:
08/07/2023
Math, Grade 7, Putting Math to Work
Conditional Remix & Share Permitted
CC BY-NC
Rating
0.0 stars

Putting Math to Work

Type of Unit: Problem Solving

Prior Knowledge

Students should be able to:

Solve problems involving all four operations with rational numbers.
Write ratios and rates.
Write and solve proportions.
Solve problems involving scale.
Write and solve equations to represent problem situations.
Create and interpret maps, graphs, and diagrams.
Use multiple representations (i.e., tables, graphs, and equations) to represent problem situations.
Calculate area and volume.
Solve problems involving linear measurement.

Lesson Flow

Students apply and integrate math concepts they have previously learned to solve mathematical and real-world problems using a variety of strategies. Students have opportunities to explore four real-world situations involving problem solving in a variety of contexts, complete a project of their choice, and work through a series of Gallery problems.

First, students utilize their spatial reasoning and visualization skills to find the least number of cubes needed to construct a structure when given the front and side views. Then, students select a project to complete as they work through this unit to refine their problem-solving skills. Students explore the relationship between flapping frequency, amplitude, and cruising speed to calculate the Strouhal number of a variety of flying and swimming animals. After that, students explore the volume of the Great Lakes, applying strategies for solving volume problems and analyzing diagrams. Next, students graphically represent a virtual journey through the locks of the Welland Canal, estimating the amount of drop through each lock and the distance traveled. Students have a day in class to work on their projects with their group.

Then, students have two days to explore Gallery problems of their choosing. Finally, students present their projects to the class.

Subject:
Mathematics
Provider:
Pearson