Using Formulas To Represent Different Rate Relationships

Overview
In this lesson, students write formulas to represent different rate relationships.
Key Concepts
A formula is a mathematical way of writing a rule for computing a value.
Formulas, like c = 2.50w or d = 20g, describe the relationship between quantities.
- The formula c = 2.50w describes the relationship between a cost and a quantity that costs $2.50 per unit of weight. Here, w stands for any weight, and c stands for the cost of w pounds at $2.50 per pound.
- The formula d = 20g describes the relationship between the distance, d, and the number of gallons of gas, g, for a car that gets 20 miles per gallon.
Goals and Learning Objectives
- Use equations with two variables to express relationships between quantities that vary together.
About Formulas
Lesson Guide
In this lesson, students revisit some familiar rate relationships. The students' challenge is to think about what formulas (or mathematical rules) they can write to represent rates in different situations. Discuss what a formula is.
- A formula is a mathematical way of writing a rule for computing a value.
- Using a formula allows us to solve many related problems. For example, substituting the values for the length and width of any rectangle allows us to find its area.
Opening
About Formulas
You may already know the formula for the area of a rectangle: A = lw.
A formula is a mathematical way of writing a rule for computing a value. The formula A = lw says that to find the area of any rectangle, multiply the rectangle’s length by its width. Today, you’ll revisit four rate situations and write formulas for them.
- How can you express speed as a formula?
Math Mission
Lesson Guide
Discuss the Math Mission. Students will write formulas to represent rate relationships. Make sure students know both what a formula is and what a rate relationship is.
Opening
Express rate relationships using formulas.
Price
Lesson Guide
Before students can write formulas, they need to find the rates. By now, most students should feel comfortable dividing to find a rate, but keep an eye out for students who still struggle with this task. Suggest that students look in their notebook for strategies to use to find the rate in each situation.
In the next four tasks, students will encounter a rate situation in different forms. They will need to find a rate from the information shown in a table, on a double number line, in text form, and on a graph.
The third situation is probably the trickiest, as it asks students to find a rate in hours per mile, rather than in the more familiar miles per hour. If students get stuck, suggest that they look at their notes from Lesson 3, where they first worked with a rate expressed in two different ways.
ELL: Add a visual to go with each formula so that students can associate the formula with the visual. It would be helpful to summarize the information in table form so that it is organized for students.
SWD: If students are demonstrating difficulty interpreting and analyzing the information in the table (and the relationships between the data), consider highlighting columns that correlate and/or color-coding values to highlight how they evolve into formulas.
Interventions
Student has difficulty getting started.
- Describe the Task in your own words to your partner.
- Can you review your notes from previous lessons to help?
- Between which two quantities is the relationship given?
- How can you use the rate to write a formula? What two variables will you use?
Student does not understand how to find the rate from information in a table, on a double number line, or on a graph.
- What two quantities are being compared?
- What operation can you use to express the rate in the form A per B?
- What does a point on the graph represent?
- How can you use the graph to find the rate?
Student has a solution:
- Explain how you solved the problems.
- How did you find the rate from information in the table/graph/double number line?
- How did you know how to express the rate relationship as a formula?
Mathematical Practices
Mathematical Practice 1: Make sense of problems and persevere in solving them.
- Students must make sense of four rate situations that are presented in four different ways. Identify students who are able to find the rates and write the formulas correctly. These students are able to interpret the situations and model them as formulas.
Mathematical Practice 6: Attend to precision.
- Watch for students who do not interpret the rate situations correctly and find inverse rates or use the wrong units. These students need to attend to precision when solving problems.
Answers
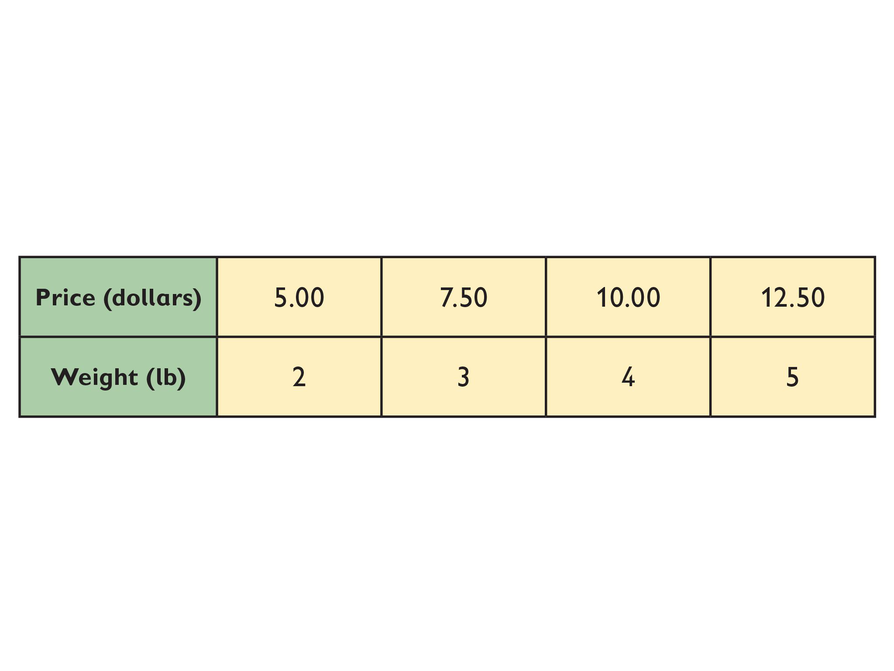
- The unit price of the apples is $2.50 per pound.
- The formula is p = 2.5w.
Work Time
Price
In the following Tasks, you’ll look at four situations that describe rate relationships.
Situation 1: Price
Look at the table.
- Find the rate (the unit price).
- Write a formula for finding the price in dollars of any weight in pounds of apples.
Hint:
- What are the two quantities in the situation?
- Choose a variable for each of the quantities.
- How much does 1 lb of apples cost?
- How do you express a formula for any amount of apples at the unit price?
Fuel Efficiency
Lesson Guide
Before students can write formulas, they need to find the rates. By now, most students should feel comfortable dividing to find a rate, but keep an eye out for students who still struggle with this task. Suggest that students look in their notebook for strategies to use to find the rate in each situation.
The rate situation in this task involves fuel effiiency. The format is a double number line.
ELL: Add a visual to go with each formula so that students can associate the formula with the visual. It would be helpful to summarize the information in table form so that it is organized for students.
SWD: If students are demonstrating difficulty interpreting and analyzing the information in the table (and the relationships between the data) consider highlighting columns that correlate and/or color-coding values to highlight how they evolve into formulas.
Interventions
Student has difficulty getting started.
- Describe the Task in your own words to your partner.
- Can you review your notes from previous lessons to help?
- Between which two quantities is the relationship given?
- How can you use the rate to write a formula? What two variables will you use?
Student does not understand how to find the rate from information in a table, on a double number line, or on a graph.
- What two quantities are being compared?
- What operation can you use to express the rate in the form A per B?
- What does a point on the graph represent?
- How can you use the graph to find the rate?
Student has a solution:
- Explain how you solved the problems.
- How did you find the rate from information in the table/graph/double number line?
- How did you know how to express the rate relationship as a formula?
Answers
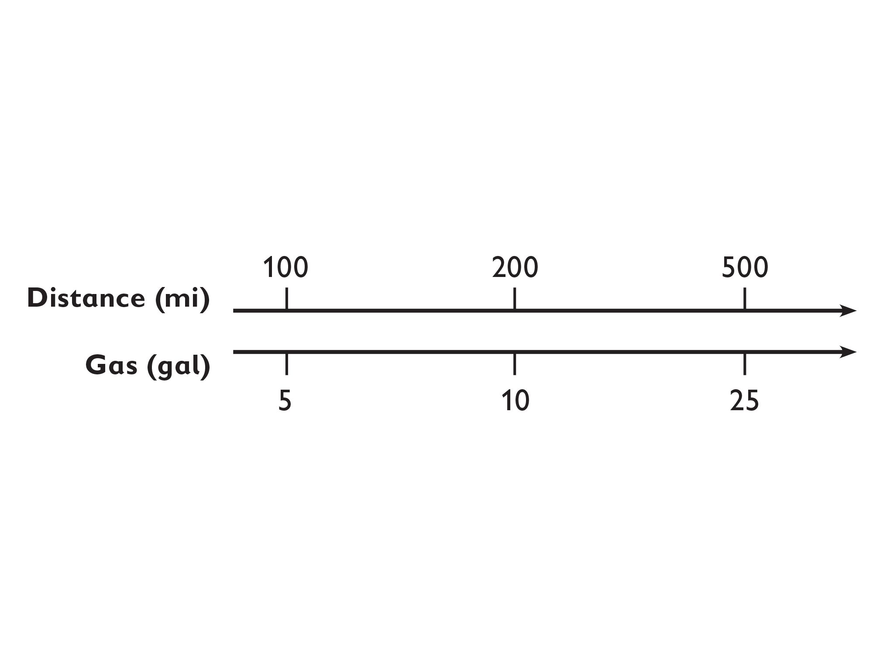
- The fuel efficiency rate is 20 miles per gallon.
- The formula is d = 20g.
Work Time
Fuel Efficiency
Situation 2: Fuel Efficiency
Use the information on the double number line to do the following.
- Find the fuel efficiency rate.
- Write a formula for finding the distance in miles for any number of gallons of gas.
Time
Lesson Guide
Before students can write formulas, they need to find the rates. By now, most students should feel comfortable dividing to find a rate, but keep an eye out for students who still struggle with this task. Suggest that students look in their notebook for strategies to use to find the rate in each situation.
The rate situation in this task involves time. The format is a word problem.
This situation is probably the trickiest, as it asks students to find a rate in hours per mile, rather than in the more familiar miles per hour. If students get stuck, suggest that they look at their notes from Lesson 3, where they first worked with a rate expressed in two different ways.
ELL: Add a visual to go with each formula so that students can associate the formula with the visual. It would be helpful to summarize the information in table form so that it is organized for students.
SWD: If students are demonstrating difficulty interpreting and analyzing the information in the table (and the relationships between the data) consider highlighting columns that correlate and/or color-coding values to highlight how they evolve into formulas.
Interventions
Student has difficulty getting started.
- Describe the Task in your own words to your partner.
- Can you review your notes from previous lessons to help?
- Between which two quantities is the relationship given?
- How can you use the rate to write a formula? What two variables will you use?
Student does not understand how to find the rate from information in a table, on a double number line, or on a graph.
- What two quantities are being compared?
- What operation can you use to express the rate in the form A per B?
- What does a point on the graph represent?
- How can you use the graph to find the rate?
Student has a solution:
- Explain how you solved the problems.
- How did you find the rate from information in the table/graph/double number line?
- How did you know how to express the rate relationship as a formula?
Answers
- Chen's speed is 0.25 hour per mile.
- The formula is t = 0.25d.
Work Time
Time
Situation 3: Time
Chen walks 16 miles in 4 hours.
- Find Chen’s rate of walking in hours per mile.
- Write a formula for finding the time in hours it will take Chen to walk any distance in miles.
Speed
Lesson Guide
Before students can write formulas, they need to find the rates. By now, most students should feel comfortable dividing to find a rate, but keep an eye out for students who still struggle with this task. Suggest that students look in their notebook for strategies to use to find the rate in each situation.
The rate situation in this task involves speed. The format is a graph.
ELL: Add a visual to go with each formula so that students can associate the formula with the visual. It would be helpful to summarize the information in table form so that it is organized for students.
SWD: If students are demonstrating difficulty interpreting and analyzing the information in the table (and the relationships between the data) consider highlighting columns that correlate and/or color-coding values to highlight how they evolve into formulas.
Interventions
Student has difficulty getting started.
- Describe the Task in your own words to your partner.
- Can you review your notes from previous lessons to help?
- Between which two quantities is the relationship given?
- How can you use the rate to write a formula? What two variables will you use?
Student does not understand how to find the rate from information in a table, on a double number line, or on a graph.
- What two quantities are being compared?
- What operation can you use to express the rate in the form A per B?
- What does a point on the graph represent?
- How can you use the graph to find the rate?
Student has a solution:
- Explain how you solved the problems.
- How did you find the rate from information in the table/graph/double number line?
- How did you know how to express the rate relationship as a formula?
Answers
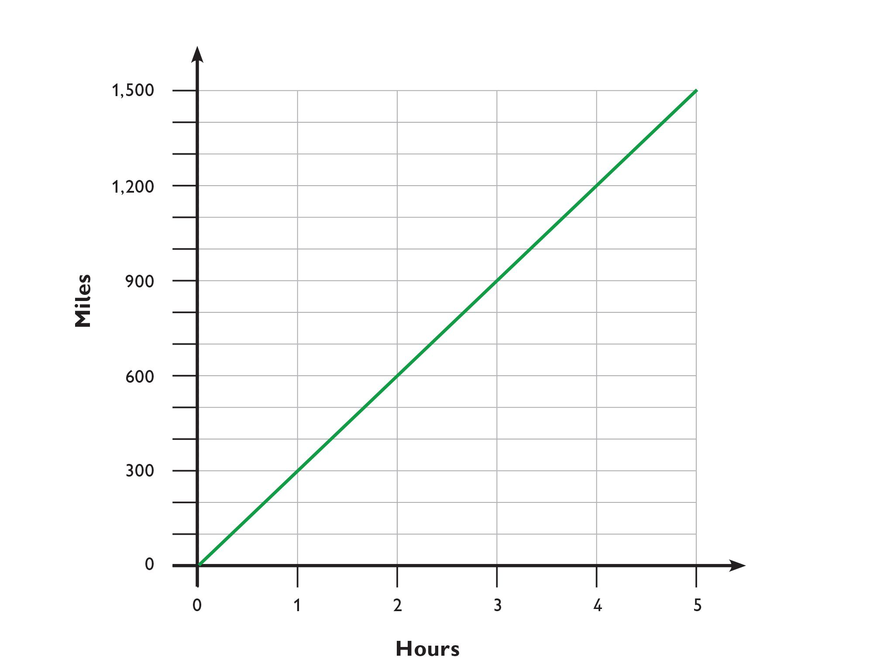
- The speed is 300 miles per hour.
- The formula is d = 300t.
Work Time
Speed
Situation 4: Speed
- Find the speed in miles per hour.
- Write a formula for finding the distance in miles for any time in hours.
Prepare a Presentation
Preparing for Ways of Thinking
- Look for students who calculated an incorrect rate and have the class help them find the rate correctly.
- Look for students who are successful at finding the rate from the various representations: the table, the double number line, the graph, and the statement. If you observe more than one method for finding the rate from these representations, be sure to select a variety of methods to present.
- Look for students who make clear connections between the four situations and who are able to make a general statement about representing rates.
Challenge Problem
Answers
- Answers will vary depending on the real-world situation that involves a rate.
Work Time
Prepare a Presentation
- Prepare a presentation on the four situations:
Situation 1: Price
Situation 2: Fuel Efficiency
Situation 3: Time
Situation 4: Speed - Compare the situations. What is similar, and what is different? Generalize your findings to all rate situations.
Challenge Problem
Rates appear in many real-world situations: reading speed, the number of revolutions per minute of a bicycle’s wheels, how much water a leaky faucet drips over time, and so on.
- Find a real-world situation that involves a rate. Investigate the rate, graph it, and make a table of values. Then write a formula for using the rate.
Make Connections
Lesson Guide
By the end of the discussion, students should understand each other's methods and make connections between methods.
Move back and forth between the various representations and challenge students to find where in each representation they see the rate. Encourage students to critique each method.
SWD: Students with disabilities may need additional support seeing the relationships among problems and strategies. Throughout this unit, keeping anchor charts available and visible will assist them in making connections and working toward mastery. Provide explicit think-alouds comparing strategies and making connections. In addition, ask probing questions to get students to articulate how a peer solved the problem or how one strategy or visual representation is connected or related to another.
Mathematics
Compare the different situations by asking questions such as the following:
- For each situation, how did you make sense of the problem in order to find the rate?
- Did anyone use a different method for any of the situations? What did you do?
- Where do you see the rate in the table? On the double number line? In the text? On the graph?
- How can you model each rate relationship as a formula?
- How can you check that your formula makes sense?
Performance Task
Ways of Thinking: Make Connections
- Take notes as you compare the different situations.
Hint:
As your classmates present, ask questions such as:
- How did you make sense of the problem in order to find the rate?
- Where do you see the rate in the table? On the double number line? In the text? On the graph?
- How can you model each rate relationship as a formula?
- How can you check your formula to make sure it makes sense?
Summarize Your Learning
A Possible Summary
You can use formulas to write rate relationships. Formulas like c = 2.50w or d = 20g describe the relationship between quantities.
ELL: Be sure to summarize language difficulties as well as difficulties with the topic at hand.
Additional Discussion Points
- A formula is a mathematical way of writing a rule for computing a value.
- The formula c = 2.50w describes the relationship between a cost and a quantity that costs $2.50 per unit of weight. Here, w stands for any weight, and c stands for the cost of w pounds at $2.50 per pound.
- The formula d = 20g describes the relationship between distance, d, and number of gallons of gas, g, for a car that gets 20 miles per gallon.
Formative Assessment
Summary of the Math: Summarize Your Learning
- Summarize what you just learned about formulas representing rate situations.
- When you’ve finished, share your summary with another student.
Hint:
Check your summary.
- Does your summary define a formula ?
- Does your summary give an example of a formula and what it describes?
Reflect On Your Work
Lesson Guide
Have each student do a quick reflection before the end of class. Review the reflections.
ELL: Allow some additional time for ELLs to discuss the reflection with a partner before writing, to help them organize their thoughts. Allow ELLs who share the same primary language to discuss in their preferred language, and to use a dictionary (or dictionaries).
Work Time
Reflection
Write a reflection about the ideas discussed in class today. Use the sentence starter below if you find it to be helpful.
The reason I find writing a formula for a rate relationship to be helpful is …