Analyze spending, research costs, and plan for purchases using a spreadsheet. Time to complete: 7-9 hours
- Subject:
- Financial Literacy
- Technology
- Material Type:
- Lesson
- Lesson Plan
- Provider:
- Provider Set:
- Applied Digital Skills
- Date Added:
- 05/03/2022

Analyze spending, research costs, and plan for purchases using a spreadsheet. Time to complete: 7-9 hours

Principles of Macroeconomics 2e covers the scope and sequence of most introductory economics courses. The text includes many current examples, which are handled in a politically equitable way. The outcome is a balanced approach to the theory and application of economics concepts. The second edition has been thoroughly revised to increase clarity, update data and current event impacts, and incorporate the feedback from many reviewers and adopters. Changes made in Principles of Macroeconomics 2e are described in the preface and the transition guide to help instructors transition to the second edition. The first edition of Principles of Macroeconomics by OpenStax is available in web view here.


Program a progress bar for a presentation using basic coding. Time to complete: 45-90 minutes

Psychology is designed to meet scope and sequence requirements for the single-semester introduction to psychology course. The book offers a comprehensive treatment of core concepts, grounded in both classic studies and current and emerging research. The text also includes coverage of the DSM-5 in examinations of psychological disorders. Psychology incorporates discussions that reflect the diversity within the discipline, as well as the diversity of cultures and communities across the globe.Senior Contributing AuthorsRose M. Spielman, Formerly of Quinnipiac UniversityContributing AuthorsKathryn Dumper, Bainbridge State CollegeWilliam Jenkins, Mercer UniversityArlene Lacombe, Saint Joseph's UniversityMarilyn Lovett, Livingstone CollegeMarion Perlmutter, University of Michigan


By the end of this section, you will be able to:
Explain what a correlation coefficient tells us about the relationship between variables
Recognize that correlation does not indicate a cause-and-effect relationship between variables
Discuss our tendency to look for relationships between variables that do not really exist
Explain random sampling and assignment of participants into experimental and control groups
Discuss how experimenter or participant bias could affect the results of an experiment
Identify independent and dependent variables


Presents a lesson on function notation. Includes interactive widget for evaluating functions.
Use critical thinking to identify credible online sources, then use basic coding to make an interactive research document. Time to complete: 3-4 hours

Students are introduced to several types of common medical sensor devices, such as ear and forehead thermometers, glucometers and wrist blood pressure monitors; they use the latter to measure their blood pressure and pulse rates. Students also measure their heights and weights in order to calculate their BMIs (body mass index). Then they use the collected data to create and analyze scatterplots of the different variables to determine if any relationships exist between the measured variables. Discussions about the trends observed and possible health concerns conclude the activity.

Students use a simple seesaw to visualize solving a two- or three-step mathematics equation, while solving a basic structural engineering weight balance problem in the process. They solve two-step equations on a worksheet and attempt to solve the challenge of "balancing a beam" through hands-on problems. The use of sensor equipment for correct position monitoring aids students in balancing the structure, as well as balancing the equation as they solve it on paper.

Through two lessons and their associated activities, students do the work of scientists by designing their own experiments to answer questions they generate. Through a simple activity involving surface tension, students learn what a hypothesis isâand isn'tâand why generating a hypothesis is an important aspect of the scientific method. In the second activity, with bubble gum to capture their interest, students learn to design and conduct controlled experiments to answer their own questions about the amounts of sugar (or artificial sweetener) in bubble or chewing gum.

Students take an in-depth look at what goes into planning a research project, which prepares them to take the lead on their own projects. Examining a case study, students first practice planning a research project that compares traditional cook stoves to improved cook stoves for use in the developing world. Then they compare their plans to one used in the real-world by professional researchers, gaining perspective and details on the thought and planning that goes into good research work. Then students are provided with example materials, a blank template and support to take them from brainstorming to completing a detailed research plan for their own air quality research projects. Conducting students’ AQ-IQ research studies requires additional time and equipment beyond this planning activity. Then after the data is collected and analyzed, teams interpret the data and present summary research posters by conducting the next associated activity Numerous student handouts and a PowerPoint® presentation are provided.

Students work as engineers to design and test trebuchets (in this case LEGO® MINDSTORMS® robots) that can launch objects. During the testing stage, they change one variable at a time to study its effect on the outcome of their designs. Specifically, they determine how far objects travel depending on their weights. As students learn about the different components of robot design and the specific function controls, they determine what design features are important for launching objects.

The airplanes unit begins with a lesson on how airplanes create lift, which involves a discussion of air pressure and how wings use Bernoulli's principle to change air pressure. Next, students explore the other three forces acting on airplanes thrust, weight and drag. Following these lessons, students learn how airplanes are controlled and use paper airplanes to demonstrate these principles. The final lessons addresses societal and technological impacts that airplanes have had on our world. Students learn about different kinds of airplanes and then design and build their own balsa wood airplanes based on what they have learned.
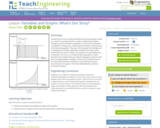
Students learn how to quickly and efficiently interpret graphs, which are used for everyday purposes as well as engineering analysis. Through a practice handout completed as a class and a worksheet completed in small groups, students gain familiarity in talking about and interpreting graphs. They use common graph terminology such as independent variable, dependent variable, linear data, linear relationship and rate of change. The equation for calculating slope is explained. The focus is on students becoming able to clearly describe linear relationships by using the language of slope and the rate of change between variables. At lesson end, students discuss the relationship between variables as presented by the visual representation of a graph. Then they independently complete a homework handout.

Choose from three video tutorials that relate to the Common Core standard HSA-CED.A.4. Topics covered include solving a formula for a variable, literal equations, and solving for a variable in terms of another variable.

This WebMath site explains how to enter your equation with one variable and solve for that variable. It explains step-by-step how to solve the equations and gives the final solutions.