
This video tutorial describes how to classify quadrilaterals using key characteristics such as parallel sides and right angles. [4:27]
- Subject:
- Mathematics
- Material Type:
- Audio/Video
- Provider:
- Sophia Learning
- Date Added:
- 12/01/2023

This video tutorial describes how to classify quadrilaterals using key characteristics such as parallel sides and right angles. [4:27]

Quadrilaterals are explored in this video lesson. The tutorial describes the characteristics of various quadrilaterals. Students can check their understanding with an assessment. [6:17]

This video lesson describes and provides examples of right, acute, and obtuse triangles. Students can check their understanding with an assessment. [2:24]

This video lesson shows examples of classifying triangles by their angle measurements. Students can check their understanding with an assessment. [3:54]
This activity is a classroom and schoolyard investigation where students collect daily temperature and precipitation readings, weather observations, and weekly phenology reports in a phenology binder and in nature journals. Students then analyze this data and compare to recorded values in the Weatherguide calendar.
In this task using a number line, students must partition the interval between 0 and 1 into eighths.
Students explore the definition of a function by playing an interactive game called "Club Function." The goal of the game is to be in the club! With students each assigned to be either a zebra or a rhinoceros, they group themselves according to the "rules" of the club function. After two minutes, students freeze in their groups, and if they are not correctly following the rules of the club function, then they are not allowed into the "club." Through this activity students come to understand that one x-coordinate can only have one corresponding y-coordinate while y-coordinates can have many x-coordinates that correspond to it.

Students will learn the basic constructs of a video game using the Scratch interface. Students use Scratch to learn about algorithms and event-driven programming. Object-oriented concepts are introduced through the use of sprites and the stage. Students use critical thinking and creativity to complete and enhance Hungry Mouse, a game that they develop using Scratch.
Estimated time required: 2 class periods.
Technology required for this lesson: Design Software, Laptop/Desktop.
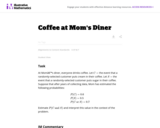
This task assesses a student's ability to use the addition rule to compute a probability and to interpret a probability in context.
Students are exptected to identify the slope of the line with the unit rate in this real world problem.

This short video and interactive assessment activity is designed to teach fourth graders about coins and bills.

This short video and interactive assessment activity is designed to teach fifth graders about coins and bills.
The Coke vs. Pepsi Taste Test Challenge has students design and carry out an experiment to determine whether or not students are able to correctly identify two brands of cola in a blind taste test. In the first stage of the activity students design and conduct the experiment. In the second part of the activity students use Sampling SIM software (freely downloadable from http://www.tc.umn.edu/~delma001/stat_tools/) to simulate and gather information on what would be expected under chance conditions (i.e., if students obtained correct answers only by guessing). The students then compare the observed results to the chance results and make an inference about whether a given student can in fact correctly identify Coke and Pepsi in a blind taste test. Finally, the experiment is critiqued in terms of how well it met the standards for a good experiment. This activity allows students to gain a better understanding of the experimental process and causality through considering control, random assignment, and possible confounding variables. The activity also allows students to begin to understand the process of hypothesis testing by comparing their observed results of the taste test to the results obtained through Sampling SIM (which model would be obtained by chance). Students make an inference about whether particular students in their class can truly tell the difference between Coke and Pepsi by reasoning about how surprising the observed results are compared to the simulated distribution of correct identifications by guessing. The activity also provides an opportunity for discussing generalizability to a population.

This professional development article identifies resources that show young learners (K-grade 5) how scientists study Earth's climate and make predictions. The online lessons either allow students to collect and analyze data or learn about tools and technologies that make data collection possible. The lessons are aligned with national content standards for science education. The article appears in the free, online magazine Beyond Weather and the Water Cycle, which examines the recognized essential principles of climate literacy and the climate sciences for elementary teachers and their students.

The NOVA collection on PBS LearningMedia contains over 1500 resources from NOVA's broadcast and digital productions that educators can use in their lessons to spark and enrich student knowledge of STEM (Science Technology Engineering Mathematics). NOVA's resources are primarily designed for use in middle and high school STEM classrooms. This Collection includes: Video (1121), Document (181), Media Gallery (129), Interactive (72), Audio (4), Lesson Plan (55), Interactive Lesson (24) for Grades All , Resources in Spanish (328).

This page includes a tutorial which teaches you how to find the Greatest Common Factor (GCF) of a polynomial, factor out the GCF of a polynomial, factor a polynomial with four terms by grouping, factor trinomials, and factor a difference of two squares, among other things. Provides examples which are worked through step by step and provides some practice problems.

Given a line, learn how to find the equations for lines that are perpendicular and parallel to it. This tutorial offers several example graphs and problems as well as practice problems for you to work through when you're ready.
n this task, students are able to conjecture about the differences in the two groups from a strictly visual perspective and then support their comparisons with appropriate measures of center and variability. This will reinforce that much can be gleaned simply from visual comparison of appropraite graphs, particularly those of similar scale. Students are also encouraged to consider how certain measurements and observation values from one group compare in the context of the other group.
The purpose of this task is to help students understand the connection between counting and cardinality. Thus, oral counting and recording the number in digit form are the most important aspects of this activity. However, teachers can extend this by making a bar graph about how many students are wearing the color each day.
The primary purpose of this problem is to rewrite simple rational expressions in different forms to exhibit different aspects of the expression, in the context of a relevant real-world context (the fuel efficiency of of a car). Indeed, the given form of the combined fuel economy computation is useful for direct calculation, but if asked for an approximation, is not particularly helpful.