In this exploratory lesson, students will train a machine learning model by …
In this exploratory lesson, students will train a machine learning model by classifying fish and other objects. This lesson aligns to national Computer Science standards from CSTA.
Explore commercial truck driving from a leader of a commercial truck driving …
Explore commercial truck driving from a leader of a commercial truck driving school. Hear from an experienced truck driver and discover whether you might be a good fit for this high-paying and rewarding career.
Students are introduced to the "Walk the Line" challenge question. They write …
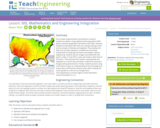
Students are introduced to the "Walk the Line" challenge question. They write journal responses to the question and brainstorm what information they need to answer the question. Ideas are shared with the class (or in pairs and then to the class, if class size is large). Then students read an interview with an engineer to gain a professional perspective on linear data sets and best-fit lines. Students brainstorm for additional ideas and add them to the list. With the teacher's guidance, students organize the ideas into logical categories of needed knowledge.
As if they are environmental engineers, student pairs are challenged to use …
As if they are environmental engineers, student pairs are challenged to use Google Earth Pro (free) GIS software to view and examine past data on hurricanes and tornados in order to (hypothetically) advise their state government on how to proceed with its next-year budget—to answer the question: should we reduce funding for natural disaster relief? To do this, students learn about maps, geographic information systems (GIS) and the global positioning system (GPS), and how they are used to deepen the way maps are used to examine and analyze data. Then they put their knowledge to work by using the GIS software to explore historical severe storm (tornado, hurricane) data in depth. Student pairs confer with other teams, conduct Internet research on specific storms and conclude by presenting their recommendations to the class. Students gain practice and perspective on making evidence-based decisions. A slide presentation as well as a student worksheet with instructions and questions are provided.
Students investigate the relationship between daily weather and seasonal weather. Students will …
Students investigate the relationship between daily weather and seasonal weather. Students will read about how weather data is collected, then interpret examples of weekly and monthly weather data to find seasonal patterns. Visual supports (images), maps, and data alongside informational text provide students with the context they need to recognize differences between daily and seasonal weather. Support materials are provided.
Students pass around and distort messages written on index cards to learn …
Students pass around and distort messages written on index cards to learn how we use signals from GPS occultations to study the atmosphere. The cards represent information sent from GPS satellites being distorted as they pass through different locations in the Earth's atmosphere and reach other satellites. Analyzing GPS occultations enables better global weather forecasting, storm tracking and climate change monitoring.
The AirData website gives you access to air quality data collected at …
The AirData website gives you access to air quality data collected at outdoor monitors across the United States, Puerto Rico, and the U. S. Virgin Islands. The data comes primarily from the AQS (Air Quality System) database. You can choose from several ways of looking at the data: download data into a file, output the data into one of AirData's standard reports, create graphical displays using one of the visualization tools, and investigate monitor locations using an interactive map
Light up a future career path as you learn about this power-filled …
Light up a future career path as you learn about this power-filled hands-on career (college not required!) See the Lab Squad kids’ report for this career in Support Materials +
The educator evaluates the effectiveness of digital learning to support all learners, …
The educator evaluates the effectiveness of digital learning to support all learners, reflects on their practice, and uses the data to develop SMART goals and pursue relevant professional learning opportunities for continuous improvement. The educator evaluates the effectiveness of digital learning to support all learners, reflects on their practice, and uses the data to develop SMART goals and pursue relevant professional learning opportunities for continuous improvement.
Approximate time to complete this course is 3 hours. A micro-credential is available from Digital Promise upon completion.
Follow three young bird watchers as they count how many birds they …
Follow three young bird watchers as they count how many birds they can find outside. The bird watchers count how many cardinals, blue jays, and goldfinches they see outside, then learn how to chart the results. Includes teacher background reading and activity instructions. The activity has students create graphs on paper but this could easily be done using an interactive whiteboard, computer software, or an app. [2:06]
Read the die to find out how many repetitions of each exercise …
Read the die to find out how many repetitions of each exercise to do. Then exercise along with the kids in the video to improve your number recognition and fitness level at the same time. [5:37]
The concept of geocaching is introduced as a way for students to …
The concept of geocaching is introduced as a way for students to explore using a global positioning system (GPS) device and basic geographic information (GIS) skills. Students familiarize themselves with GPS, GIS, and geocaching as well as the concepts of latitude and longitude. They develop the skills and concepts needed to complete the associated activity while considering how these technologies relate to engineering. Students discuss images associated with GPS, watch a video on how GPS is used, and review a slide show of GIS basics. They estimate their location using latitude and longitude on a world map and watch a video that introduces the geocaching phenomenon. Finally, students practice using a GPS device to gain an understanding of the technology and how location and direction features work while sending and receiving data to a GIS such as Google Earth.
In this open-ended, hands-on activity that provides practice in engineering data analysis, …
In this open-ended, hands-on activity that provides practice in engineering data analysis, students are given gait signature metric (GSM) data for known people types (adults and children). Working in teams, they analyze the data and develop models that they believe represent the data. They test their models against similar, but unknown (to the students) data to see how accurate their models are in predicting adult vs. child human subjects given known GSM data. They manipulate and graph data in Excel® to conduct their analyses.
Students take on the role of geographers and civil engineers and use …
Students take on the role of geographers and civil engineers and use a device enabled with the global positioning system (GPS) to locate geocache locations via a number of waypoints. Teams save their data points, upload them to geographic information systems (GIS) software, such as Google Earth, and create scale drawings of their explorations while solving problems of area, perimeter and rates. The activity is unique in its integration of technology for solving mathematical problems and asks students to relate GPS and GIS to engineering.
No restrictions on your remixing, redistributing, or making derivative works. Give credit to the author, as required.
Your remixing, redistributing, or making derivatives works comes with some restrictions, including how it is shared.
Your redistributing comes with some restrictions. Do not remix or make derivative works.
Most restrictive license type. Prohibits most uses, sharing, and any changes.
Copyrighted materials, available under Fair Use and the TEACH Act for US-based educators, or other custom arrangements. Go to the resource provider to see their individual restrictions.